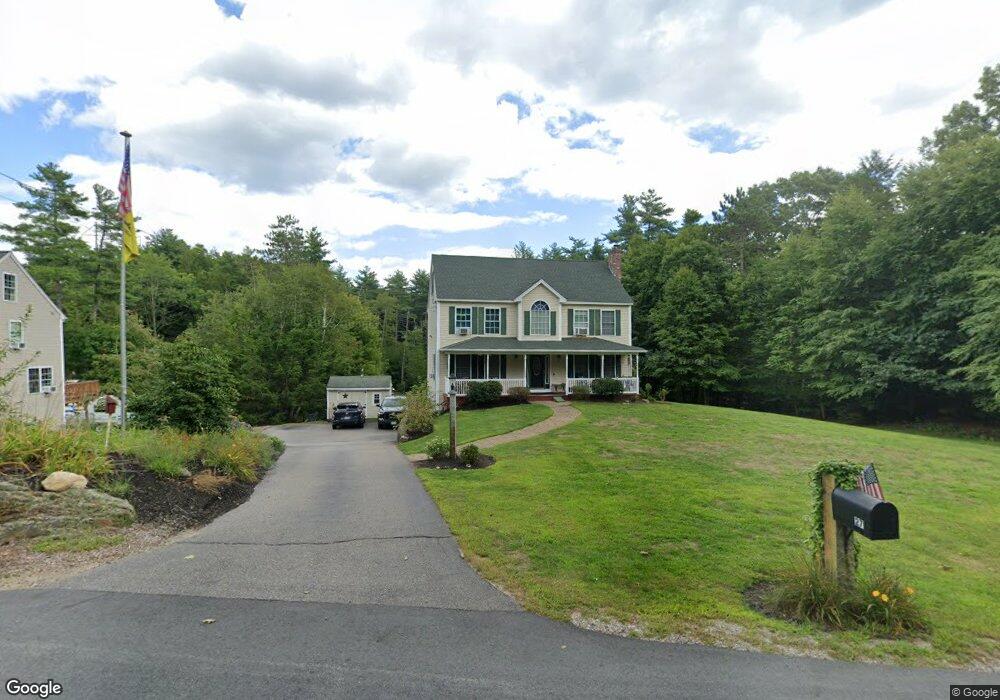
27 Cross Rd Sandown, NH 03873
Estimated Value: $578,000 - $654,000
3
Beds
3
Baths
2,127
Sq Ft
$289/Sq Ft
Est. Value
About This Home
This home is located at 27 Cross Rd, Sandown, NH 03873 and is currently estimated at $615,572, approximately $289 per square foot. 27 Cross Rd is a home located in Rockingham County with nearby schools including Sandown North Elementary School, Timberlane Regional Middle School, and Timberlane Regional High School.
Ownership History
Date
Name
Owned For
Owner Type
Purchase Details
Closed on
Apr 11, 2001
Sold by
Delridge Rlty Corp
Bought by
Abood Jason C and Abood Melinda A S
Current Estimated Value
Home Financials for this Owner
Home Financials are based on the most recent Mortgage that was taken out on this home.
Original Mortgage
$165,000
Interest Rate
6.97%
Purchase Details
Closed on
Jan 18, 2001
Sold by
Hatch Kevin E
Bought by
Delridge Rlty Corp
Create a Home Valuation Report for This Property
The Home Valuation Report is an in-depth analysis detailing your home's value as well as a comparison with similar homes in the area
Home Values in the Area
Average Home Value in this Area
Purchase History
| Date | Buyer | Sale Price | Title Company |
|---|---|---|---|
| Abood Jason C | $343,300 | -- | |
| Delridge Rlty Corp | $53,000 | -- |
Source: Public Records
Mortgage History
| Date | Status | Borrower | Loan Amount |
|---|---|---|---|
| Open | Delridge Rlty Corp | $210,000 | |
| Closed | Delridge Rlty Corp | $35,000 | |
| Closed | Delridge Rlty Corp | $165,000 |
Source: Public Records
Tax History Compared to Growth
Tax History
| Year | Tax Paid | Tax Assessment Tax Assessment Total Assessment is a certain percentage of the fair market value that is determined by local assessors to be the total taxable value of land and additions on the property. | Land | Improvement |
|---|---|---|---|---|
| 2024 | $8,972 | $506,300 | $153,900 | $352,400 |
| 2023 | $10,582 | $506,300 | $153,900 | $352,400 |
| 2022 | $8,905 | $313,900 | $107,300 | $206,600 |
| 2021 | $9,097 | $313,900 | $107,300 | $206,600 |
| 2020 | $8,682 | $313,900 | $107,300 | $206,600 |
| 2019 | $8,463 | $313,900 | $107,300 | $206,600 |
| 2018 | $8,331 | $313,900 | $107,300 | $206,600 |
| 2017 | $7,990 | $259,600 | $86,300 | $173,300 |
| 2016 | $7,532 | $258,300 | $86,300 | $172,000 |
| 2015 | $6,881 | $258,300 | $86,300 | $172,000 |
| 2014 | $7,126 | $258,300 | $86,300 | $172,000 |
| 2013 | $6,995 | $258,300 | $86,300 | $172,000 |
Source: Public Records
Map
Nearby Homes
- 61 Sargent Rd
- 8 Eastfield Loop
- 209 Fremont Rd
- 30 Saw Mill Ridge
- 5 Lilac Ln
- 534 Main St
- 53 Driftwood Cir Unit 20
- 35 Royal Range Rd
- 15 Brightstone Way Unit 14
- 21 Brightstone Way Unit 17
- 44 Pheasant Run Dr
- 10 Raven Dr
- 63 Driftwood Cir Unit 24
- 59 Driftwood Cir Unit 22
- 275 Fremont Rd
- 392 Fremont Rd
- 37 Reed Rd
- 21 Penacook Rd
- 31 N Shore Rd
- 118 Hall Rd Unit 3