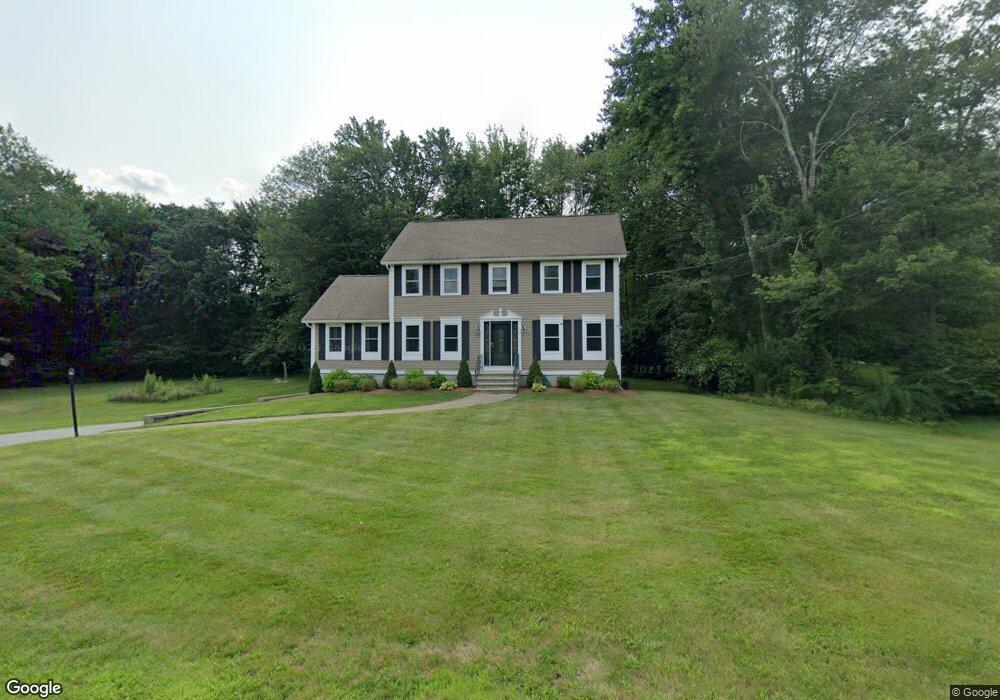
27 Dandridge Ave Salem, NH 03079
Depot Village NeighborhoodEstimated Value: $673,129 - $929,000
4
Beds
3
Baths
2,104
Sq Ft
$373/Sq Ft
Est. Value
About This Home
This home is located at 27 Dandridge Ave, Salem, NH 03079 and is currently estimated at $784,282, approximately $372 per square foot. 27 Dandridge Ave is a home located in Rockingham County with nearby schools including William E. Lancaster School, Woodbury School, and Salem High School.
Ownership History
Date
Name
Owned For
Owner Type
Purchase Details
Closed on
Feb 19, 2010
Sold by
Howshan Karen M
Bought by
Brouillard Michael R and Brouillard Lisa M
Current Estimated Value
Home Financials for this Owner
Home Financials are based on the most recent Mortgage that was taken out on this home.
Original Mortgage
$323,100
Interest Rate
5.17%
Mortgage Type
Purchase Money Mortgage
Purchase Details
Closed on
Aug 18, 2004
Sold by
American Intl Relocati
Bought by
Clark Robert and Clark Karen
Purchase Details
Closed on
Aug 6, 1999
Sold by
Carpenito Jane V
Bought by
Casale Stephen A and Casale Kelly B
Create a Home Valuation Report for This Property
The Home Valuation Report is an in-depth analysis detailing your home's value as well as a comparison with similar homes in the area
Home Values in the Area
Average Home Value in this Area
Purchase History
| Date | Buyer | Sale Price | Title Company |
|---|---|---|---|
| Brouillard Michael R | $359,000 | -- | |
| Clark Robert | $425,000 | -- | |
| American Internatl Rel | $425,000 | -- | |
| Casale Stephen A | $240,000 | -- |
Source: Public Records
Mortgage History
| Date | Status | Borrower | Loan Amount |
|---|---|---|---|
| Open | Casale Stephen A | $307,500 | |
| Closed | Casale Stephen A | $323,100 | |
| Previous Owner | Casale Stephen A | $25,450 |
Source: Public Records
Tax History Compared to Growth
Tax History
| Year | Tax Paid | Tax Assessment Tax Assessment Total Assessment is a certain percentage of the fair market value that is determined by local assessors to be the total taxable value of land and additions on the property. | Land | Improvement |
|---|---|---|---|---|
| 2024 | $9,574 | $544,000 | $209,300 | $334,700 |
| 2023 | $9,226 | $544,000 | $209,300 | $334,700 |
| 2022 | $8,731 | $544,000 | $209,300 | $334,700 |
| 2021 | $8,693 | $544,000 | $209,300 | $334,700 |
| 2020 | $8,531 | $387,400 | $149,500 | $237,900 |
| 2019 | $8,515 | $387,400 | $149,500 | $237,900 |
| 2018 | $8,372 | $387,400 | $149,500 | $237,900 |
| 2017 | $8,073 | $387,400 | $149,500 | $237,900 |
| 2016 | $7,915 | $387,400 | $149,500 | $237,900 |
| 2015 | $7,221 | $337,600 | $147,800 | $189,800 |
| 2014 | $7,019 | $337,600 | $147,800 | $189,800 |
| 2013 | $6,907 | $337,600 | $147,800 | $189,800 |
Source: Public Records
Map
Nearby Homes