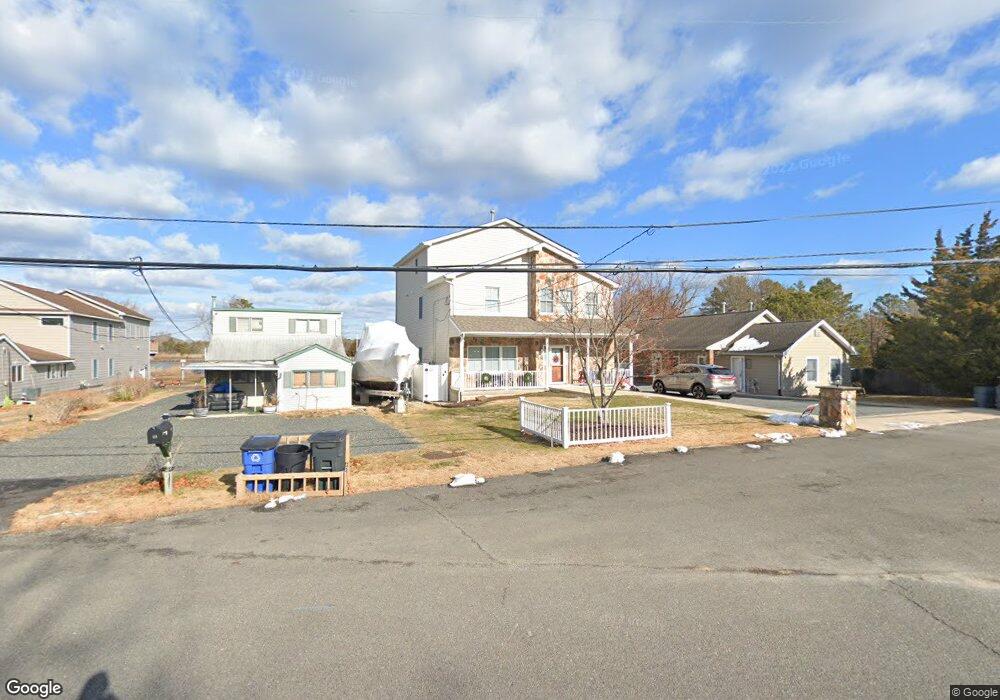
27 Dock Ave Waretown, NJ 08758
Estimated Value: $1,072,000 - $1,503,000
4
Beds
4
Baths
4,082
Sq Ft
$297/Sq Ft
Est. Value
About This Home
This home is located at 27 Dock Ave, Waretown, NJ 08758 and is currently estimated at $1,213,597, approximately $297 per square foot. 27 Dock Ave is a home located in Ocean County with nearby schools including Waretown Elementary School and Frederic A. Priff Elementary School.
Ownership History
Date
Name
Owned For
Owner Type
Purchase Details
Closed on
Mar 18, 2022
Sold by
Antonio Fonseca
Bought by
Fonseca Jolene
Current Estimated Value
Purchase Details
Closed on
Dec 17, 1999
Sold by
Sterling Land Dev
Bought by
Fonseca Antonio
Purchase Details
Closed on
Oct 28, 1999
Sold by
Universal Portfolio Buyers
Bought by
Sterling Land Dev Corp
Purchase Details
Closed on
Jul 27, 1999
Sold by
Arnwine Nancy Patricia and Cudworth Charles C
Bought by
Emc Mtg Corp
Create a Home Valuation Report for This Property
The Home Valuation Report is an in-depth analysis detailing your home's value as well as a comparison with similar homes in the area
Home Values in the Area
Average Home Value in this Area
Purchase History
| Date | Buyer | Sale Price | Title Company |
|---|---|---|---|
| Fonseca Jolene | $830,000 | Counsellors Title | |
| Fonseca Antonio | $65,000 | -- | |
| Sterling Land Dev Corp | $47,749 | -- | |
| Sterling Land Development Corp | $47,749 | -- | |
| Emc Mtg Corp | -- | -- |
Source: Public Records
Mortgage History
| Date | Status | Borrower | Loan Amount |
|---|---|---|---|
| Closed | Fonseca Antonio | $0 |
Source: Public Records
Tax History
| Year | Tax Paid | Tax Assessment Tax Assessment Total Assessment is a certain percentage of the fair market value that is determined by local assessors to be the total taxable value of land and additions on the property. | Land | Improvement |
|---|---|---|---|---|
| 2025 | $13,848 | $917,700 | $232,900 | $684,800 |
| 2024 | $14,012 | $917,700 | $232,900 | $684,800 |
Source: Public Records
Map
Nearby Homes
- 3 Dock Ave
- 32 Chestnut St
- 12 Mizzen Way
- 6 Mizzen Way
- 37 Keelson Dr
- 25 Bayberry Dr
- 16 S Olympia Dr
- 2 Gull Ct
- 7 Letts Landing Rd
- 28 Dolphin Way
- 908 Sarasota Dr
- 809 Pensacola Rd
- 16 Davey Jones Way
- 14 Hawkins Way
- 13 Jolly Roger Way
- 703 Chesapeake Dr
- 1007 Inland Rd
- 1003 Kohala Dr
- Lot1 Clearwater Dr
- 615 Beach Blvd
Your Personal Tour Guide
Ask me questions while you tour the home.