Estimated Value: $2,057,206 - $3,015,000
4
Beds
4
Baths
5,763
Sq Ft
$403/Sq Ft
Est. Value
About This Home
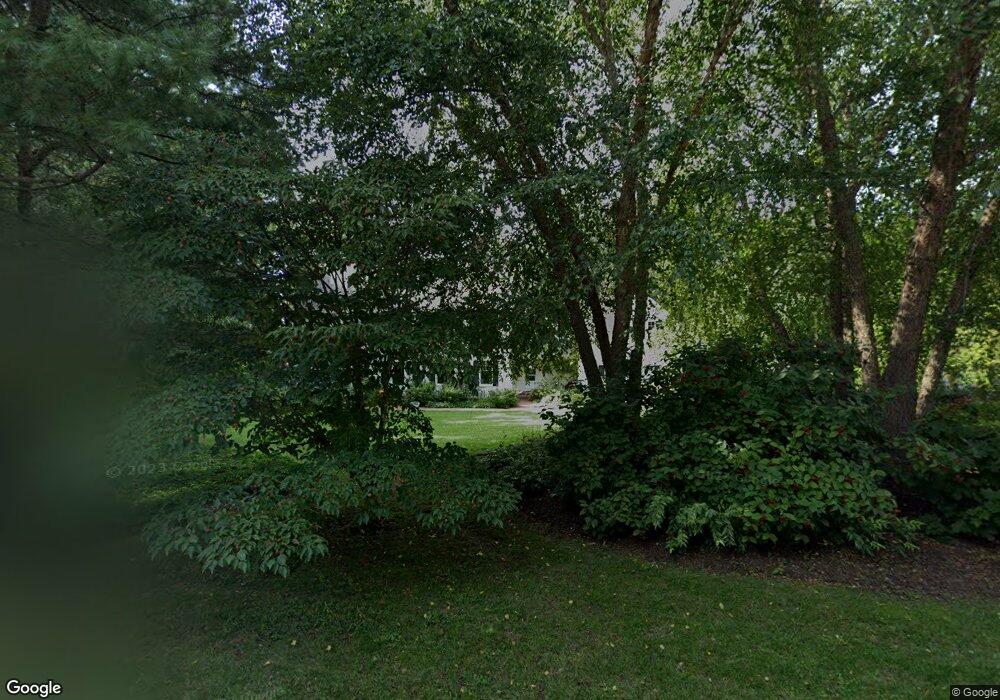
This home is located at 27 Draper Rd, Dover, MA 02030 and is currently estimated at $2,319,802, approximately $402 per square foot. 27 Draper Rd is a home located in Norfolk County with nearby schools including Chickering Elementary School, Dover-Sherborn Regional Middle School, and Dover-Sherborn Regional High School.
Ownership History
Date
Name
Owned For
Owner Type
Purchase Details
Closed on
Apr 26, 1991
Sold by
Brook Run Dev Corp
Bought by
Albion Mark S and Albion Johanna H
Current Estimated Value
Home Financials for this Owner
Home Financials are based on the most recent Mortgage that was taken out on this home.
Original Mortgage
$112,600
Interest Rate
9.41%
Mortgage Type
Purchase Money Mortgage
Create a Home Valuation Report for This Property
The Home Valuation Report is an in-depth analysis detailing your home's value as well as a comparison with similar homes in the area
Home Values in the Area
Average Home Value in this Area
Purchase History
| Date | Buyer | Sale Price | Title Company |
|---|---|---|---|
| Albion Mark S | $535,000 | -- |
Source: Public Records
Mortgage History
| Date | Status | Borrower | Loan Amount |
|---|---|---|---|
| Open | Albion Mark S | $300,000 | |
| Closed | Albion Mark S | $112,600 | |
| Closed | Albion Mark S | $120,000 |
Source: Public Records
Tax History
| Year | Tax Paid | Tax Assessment Tax Assessment Total Assessment is a certain percentage of the fair market value that is determined by local assessors to be the total taxable value of land and additions on the property. | Land | Improvement |
|---|---|---|---|---|
| 2025 | $20,209 | $1,793,200 | $598,000 | $1,195,200 |
| 2024 | $18,789 | $1,714,300 | $598,000 | $1,116,300 |
| 2023 | $17,888 | $1,467,400 | $490,200 | $977,200 |
| 2022 | $16,497 | $1,328,300 | $470,500 | $857,800 |
| 2021 | $16,712 | $1,296,500 | $470,500 | $826,000 |
| 2020 | $16,647 | $1,296,500 | $470,500 | $826,000 |
| 2019 | $16,764 | $1,296,500 | $470,500 | $826,000 |
| 2018 | $16,038 | $1,249,100 | $466,600 | $782,500 |
| 2017 | $16,614 | $1,273,100 | $466,600 | $806,500 |
| 2016 | $16,195 | $1,257,400 | $450,900 | $806,500 |
| 2015 | $15,621 | $1,230,000 | $423,500 | $806,500 |
Source: Public Records
Map
Nearby Homes
Your Personal Tour Guide
Ask me questions while you tour the home.