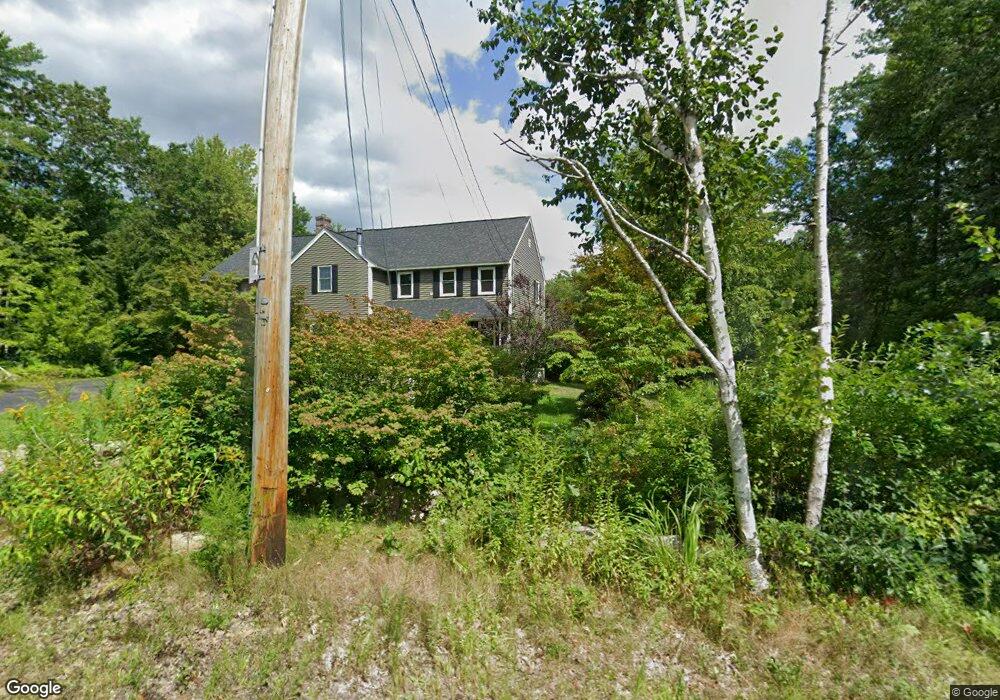
27 Dupaw Gould Rd Brookline, NH 03033
Estimated Value: $716,000 - $783,000
4
Beds
3
Baths
3,320
Sq Ft
$228/Sq Ft
Est. Value
About This Home
This home is located at 27 Dupaw Gould Rd, Brookline, NH 03033 and is currently estimated at $758,312, approximately $228 per square foot. 27 Dupaw Gould Rd is a home located in Hillsborough County with nearby schools including Richard Maghakian Memorial School, Captain Samuel Douglass Academy, and Hollis-Brookline Middle School.
Ownership History
Date
Name
Owned For
Owner Type
Purchase Details
Closed on
Jun 17, 2022
Sold by
Fiona Garcia Ret
Bought by
Mangal Puneet and Mangal Shweta
Current Estimated Value
Home Financials for this Owner
Home Financials are based on the most recent Mortgage that was taken out on this home.
Original Mortgage
$528,000
Outstanding Balance
$502,394
Interest Rate
5.27%
Mortgage Type
Purchase Money Mortgage
Estimated Equity
$255,918
Purchase Details
Closed on
Jun 7, 2021
Sold by
Gareia Fiona
Bought by
Fiona Garcia Ret
Purchase Details
Closed on
Feb 13, 2003
Sold by
Mylek Stanley P
Bought by
Strecker Frik J and Strecker Fiona
Purchase Details
Closed on
Mar 2, 1998
Sold by
Glendale Homes Inc
Bought by
Mylek Stanley P and Mylek Christine
Create a Home Valuation Report for This Property
The Home Valuation Report is an in-depth analysis detailing your home's value as well as a comparison with similar homes in the area
Home Values in the Area
Average Home Value in this Area
Purchase History
| Date | Buyer | Sale Price | Title Company |
|---|---|---|---|
| Mangal Puneet | $660,000 | None Available | |
| Fiona Garcia Ret | -- | None Available | |
| Strecker Frik J | $280,000 | -- | |
| Mylek Stanley P | $167,100 | -- |
Source: Public Records
Mortgage History
| Date | Status | Borrower | Loan Amount |
|---|---|---|---|
| Open | Mangal Puneet | $528,000 | |
| Previous Owner | Mylek Stanley P | $333,000 | |
| Previous Owner | Mylek Stanley P | $414,150 | |
| Previous Owner | Mylek Stanley P | $408,030 |
Source: Public Records
Tax History Compared to Growth
Tax History
| Year | Tax Paid | Tax Assessment Tax Assessment Total Assessment is a certain percentage of the fair market value that is determined by local assessors to be the total taxable value of land and additions on the property. | Land | Improvement |
|---|---|---|---|---|
| 2024 | $15,847 | $700,900 | $219,500 | $481,400 |
| 2023 | $14,565 | $700,900 | $219,500 | $481,400 |
| 2022 | $12,206 | $410,700 | $132,200 | $278,500 |
| 2021 | $11,738 | $410,700 | $132,200 | $278,500 |
| 2020 | $11,417 | $410,700 | $132,200 | $278,500 |
| 2019 | $12,268 | $410,700 | $132,200 | $278,500 |
| 2018 | $10,781 | $410,700 | $132,200 | $278,500 |
| 2017 | $10,659 | $323,600 | $106,800 | $216,800 |
| 2016 | $10,416 | $319,900 | $106,800 | $213,100 |
| 2015 | $9,933 | $319,900 | $106,800 | $213,100 |
| 2014 | $10,509 | $319,900 | $106,800 | $213,100 |
| 2013 | $10,118 | $319,900 | $106,800 | $213,100 |
Source: Public Records
Map
Nearby Homes
- 3 Ben Farnsworth Rd
- 7 Winterberry Rd
- 9 Winterberry Rd
- 59 Cleveland Hill Rd
- 104 N Mason Rd
- 38 Countryside Dr
- 5 Carons Way
- 22 Hobart Hill Rd
- 25 Rocky Pond Rd
- 9 Marjorie Dr
- 8 Colburn Rd
- 4 Bohanon Bridge Rd
- 42 Pepperell Rd
- 18 Sawtelle Rd
- 303 Route 13
- 6 Laurelcrest Dr
- 47 Pepperell Rd
- 6 Flint Meadow Dr
- 46 Oak Hill Rd
- 81 Badger Hill Dr
- 27 Dupaw Gould Rd
- 29 Dupaw Gould Rd
- 26 Dupaw Gould Rd
- 2 Macintosh Rd
- 31 Dupaw Gould Rd
- 24 Dupaw Gould Rd
- 33 Dupaw Gould Rd
- 21 Dupaw Gould Rd
- 22 Dupaw Gould Rd
- 4 Macintosh Rd
- 23 Dupaw Gould Rd
- 3 Macintosh Rd
- 3 Mac Intosh Rd
- 20 Dupaw Gould Rd
- 34 Dupaw Gould Rd
- 19 Dupaw Gould Rd
- 17 Dupaw Gould Rd
- 37B Dupaw Gould Rd
- 37A Dupaw Gould Rd
- 18 Dupaw Gould Rd