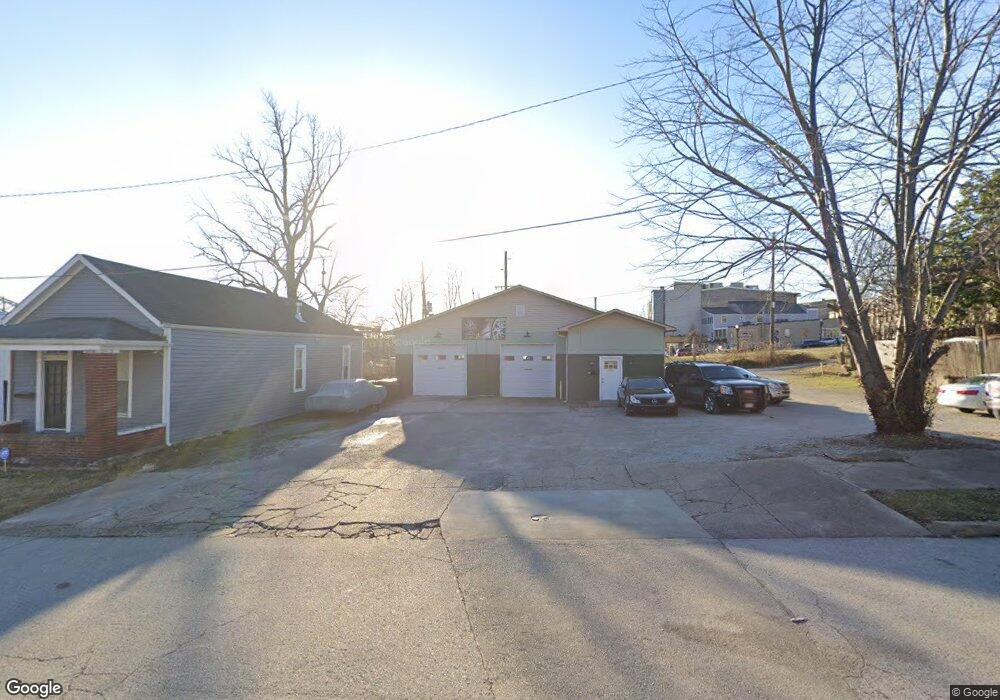
27 E 3rd St New Albany, IN 47150
Estimated Value: $88,941 - $157,000
2
Beds
1
Bath
806
Sq Ft
$153/Sq Ft
Est. Value
About This Home
This home is located at 27 E 3rd St, New Albany, IN 47150 and is currently estimated at $122,985, approximately $152 per square foot. 27 E 3rd St is a home located in Floyd County with nearby schools including S. Ellen Jones Elementary School, Nathaniel Scribner Middle School, and New Albany Senior High School.
Ownership History
Date
Name
Owned For
Owner Type
Purchase Details
Closed on
Mar 18, 2016
Sold by
New Albany Horizons Llc
Bought by
Carter Management Co Llc
Current Estimated Value
Purchase Details
Closed on
Jul 31, 2007
Sold by
Neofes Deborah D
Bought by
New Albany Horizons Llc
Home Financials for this Owner
Home Financials are based on the most recent Mortgage that was taken out on this home.
Original Mortgage
$40,000
Interest Rate
6.69%
Mortgage Type
Purchase Money Mortgage
Create a Home Valuation Report for This Property
The Home Valuation Report is an in-depth analysis detailing your home's value as well as a comparison with similar homes in the area
Home Values in the Area
Average Home Value in this Area
Purchase History
| Date | Buyer | Sale Price | Title Company |
|---|---|---|---|
| Carter Management Co Llc | -- | Kemp Title Agency Llc | |
| New Albany Horizons Llc | -- | None Available |
Source: Public Records
Mortgage History
| Date | Status | Borrower | Loan Amount |
|---|---|---|---|
| Previous Owner | New Albany Horizons Llc | $40,000 |
Source: Public Records
Tax History Compared to Growth
Tax History
| Year | Tax Paid | Tax Assessment Tax Assessment Total Assessment is a certain percentage of the fair market value that is determined by local assessors to be the total taxable value of land and additions on the property. | Land | Improvement |
|---|---|---|---|---|
| 2024 | $682 | $32,100 | $8,800 | $23,300 |
| 2023 | $745 | $34,900 | $8,800 | $26,100 |
| 2022 | $720 | $33,700 | $8,800 | $24,900 |
| 2021 | $656 | $30,500 | $8,800 | $21,700 |
| 2020 | $658 | $30,500 | $8,800 | $21,700 |
| 2019 | $608 | $28,200 | $8,800 | $19,400 |
| 2018 | $607 | $28,000 | $8,800 | $19,200 |
| 2017 | $618 | $28,000 | $8,800 | $19,200 |
| 2016 | $556 | $27,800 | $8,800 | $19,000 |
| 2014 | $486 | $24,300 | $8,800 | $15,500 |
| 2013 | -- | $23,800 | $8,800 | $15,000 |
Source: Public Records
Map
Nearby Homes
- 323 E 9th St
- 1010 E Spring St
- 416 E 11th St
- 613 W Market St
- 605 W 6th St
- 220 W 8th St
- 1119 Ekin Ave
- 1205 Ekin Ave
- 655 W 7th St
- 335 E 15th St
- 1313 Culbertson Ave
- 3931 Northwestern Pkwy
- 219 W 9th St
- 1314 Ekin Ave
- 1120 Chartres St
- 918 W Main St
- 830 Cedar Bough Place
- 330 E 16th St
- 336 E 16th St
- 1002 W Main St