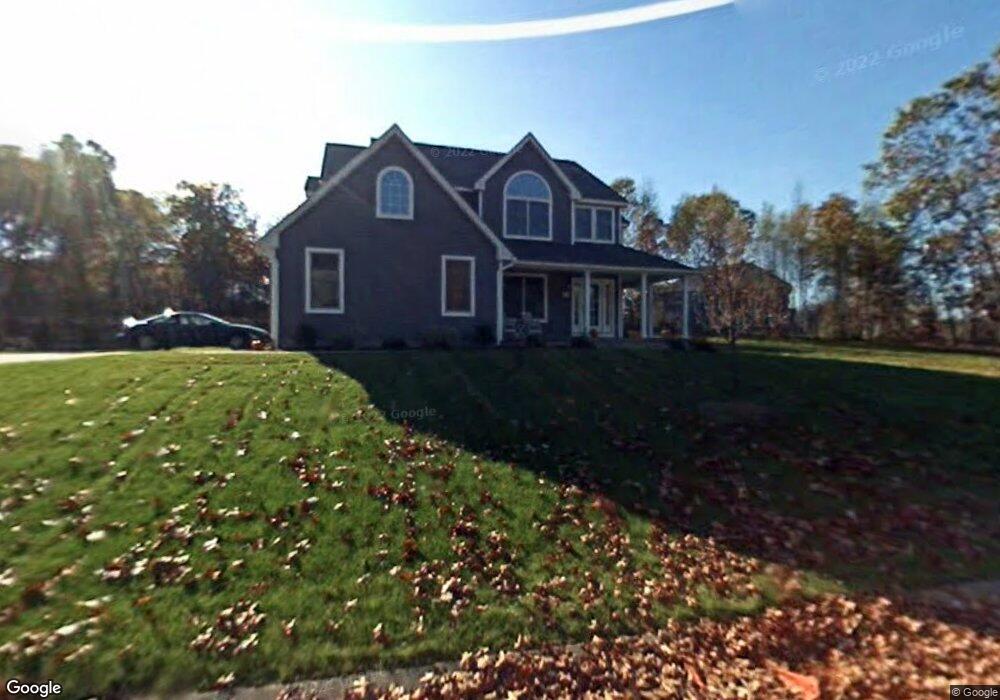
27 E Red Bridge Ln South Hadley, MA 01075
Estimated Value: $523,000 - $697,000
3
Beds
2
Baths
1,600
Sq Ft
$392/Sq Ft
Est. Value
About This Home
This home is located at 27 E Red Bridge Ln, South Hadley, MA 01075 and is currently estimated at $627,645, approximately $392 per square foot. 27 E Red Bridge Ln is a home located in Hampshire County with nearby schools including Plains Elementary School, Mosier Elementary School, and Michael E. Smith Middle School.
Ownership History
Date
Name
Owned For
Owner Type
Purchase Details
Closed on
Feb 2, 2007
Sold by
J Duquette & Son Constr
Bought by
Stclair Kelley E and Stclair Michael J
Current Estimated Value
Home Financials for this Owner
Home Financials are based on the most recent Mortgage that was taken out on this home.
Original Mortgage
$320,866
Interest Rate
6.16%
Mortgage Type
Purchase Money Mortgage
Create a Home Valuation Report for This Property
The Home Valuation Report is an in-depth analysis detailing your home's value as well as a comparison with similar homes in the area
Home Values in the Area
Average Home Value in this Area
Purchase History
| Date | Buyer | Sale Price | Title Company |
|---|---|---|---|
| Stclair Kelley E | $150,000 | -- |
Source: Public Records
Mortgage History
| Date | Status | Borrower | Loan Amount |
|---|---|---|---|
| Open | Stclair Kelley E | $50,000 | |
| Open | Stclair Kelley E | $276,500 | |
| Closed | Stclair Kelley E | $320,866 |
Source: Public Records
Tax History
| Year | Tax Paid | Tax Assessment Tax Assessment Total Assessment is a certain percentage of the fair market value that is determined by local assessors to be the total taxable value of land and additions on the property. | Land | Improvement |
|---|---|---|---|---|
| 2025 | $9,856 | $608,000 | $145,600 | $462,400 |
| 2024 | $9,722 | $586,000 | $136,000 | $450,000 |
| 2023 | $9,603 | $540,400 | $123,800 | $416,600 |
| 2022 | $9,177 | $483,500 | $123,800 | $359,700 |
| 2021 | $8,975 | $453,300 | $115,700 | $337,600 |
| 2020 | $8,510 | $418,400 | $115,700 | $302,700 |
| 2019 | $8,748 | $425,700 | $125,800 | $299,900 |
| 2018 | $8,446 | $413,600 | $122,000 | $291,600 |
| 2017 | $8,103 | $392,200 | $122,000 | $270,200 |
| 2016 | $8,114 | $396,000 | $122,800 | $273,200 |
| 2015 | $7,794 | $384,700 | $119,300 | $265,400 |
Source: Public Records
Map
Nearby Homes
- 110 Mountain View St
- Lot A East St
- 540 Granby Rd Unit 72A
- 540 Granby Rd Unit 77C
- 540 Granby Rd Unit 76B
- 540 Granby Rd Unit 131
- 24 Sunset Ave
- 67 Boynton Ave
- 289 Morgan St
- 596 Newton St
- 96 College St
- 140 Pine Grove Dr
- 4 Broad St
- 75 Pine St
- 120 Camden St
- 11 Hadley St
- 356 Newton St
- 20 Lyman Terrace
- 0 Granby Rd
- 124 Silver St
- 27 E Red Bridge Ln
- 31 E Red Bridge Ln
- 31 E Red Bridge Ln
- 26 E Red Bridge Ln
- 22 E Red Bridge Ln
- 22 E Red Bridge Ln
- 28 Red Bridge Ln
- 32 Red Bridge Ln
- 30 E Red Bridge Ln
- 35 E Red Bridge Ln
- 22 E Red Bridge Ln
- 32 Red Bridge Ln
- 32 Red Bridge Ln
- 34 E Red Bridge Ln
- 18 E Red Bridge Ln
- 36 Red Bridge Ln
- 34 E Red Bridge Ln
- 39 Red Bridge Ln
- 38 E Red Bridge Ln
- 14 E Red Bridge Ln
Your Personal Tour Guide
Ask me questions while you tour the home.