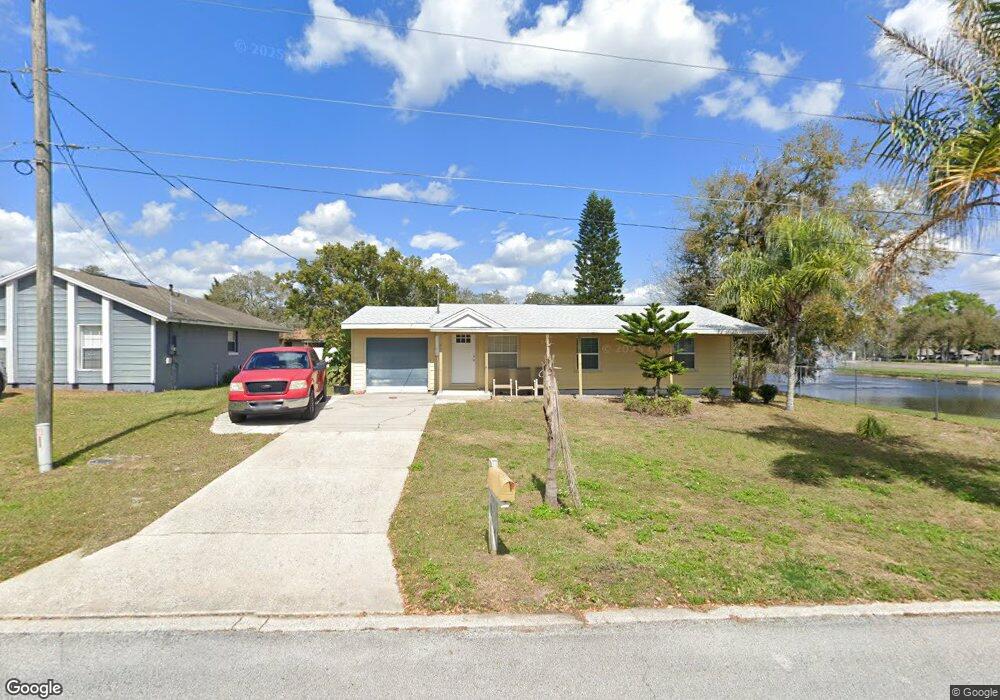
27 E Thrush St Apopka, FL 32712
Estimated Value: $246,000 - $290,000
3
Beds
2
Baths
1,264
Sq Ft
$207/Sq Ft
Est. Value
About This Home
This home is located at 27 E Thrush St, Apopka, FL 32712 and is currently estimated at $261,225, approximately $206 per square foot. 27 E Thrush St is a home located in Orange County with nearby schools including Dream Lake Elementary School, Apopka Middle School, and Apopka High School.
Ownership History
Date
Name
Owned For
Owner Type
Purchase Details
Closed on
Jan 1, 2017
Bought by
Bustillo Kristopher
Current Estimated Value
Purchase Details
Closed on
Oct 31, 2016
Sold by
Wood Patricia and Kunsman Robert
Bought by
Federal National Mortgage Association and Fannie Mae
Purchase Details
Closed on
Jul 3, 1997
Sold by
Sciabarrasi Andrew M and Aaa Trust Inc
Bought by
Kunsman Alex L
Purchase Details
Closed on
Nov 26, 1996
Sold by
Serafine James F and Serafine Barbara A
Bought by
Kunsman Alex L
Home Financials for this Owner
Home Financials are based on the most recent Mortgage that was taken out on this home.
Original Mortgage
$11,000
Interest Rate
7.83%
Purchase Details
Closed on
Oct 1, 1996
Sold by
Serafine James F
Bought by
Aaa Trust
Home Financials for this Owner
Home Financials are based on the most recent Mortgage that was taken out on this home.
Original Mortgage
$11,000
Interest Rate
7.83%
Create a Home Valuation Report for This Property
The Home Valuation Report is an in-depth analysis detailing your home's value as well as a comparison with similar homes in the area
Home Values in the Area
Average Home Value in this Area
Purchase History
| Date | Buyer | Sale Price | Title Company |
|---|---|---|---|
| Bustillo Kristopher | $86,000 | -- | |
| Federal National Mortgage Association | $61,100 | None Available | |
| Kunsman Alex L | $5,000 | -- | |
| Kunsman Alex L | $35,000 | -- | |
| Aaa Trust | $36,000 | -- |
Source: Public Records
Mortgage History
| Date | Status | Borrower | Loan Amount |
|---|---|---|---|
| Previous Owner | Aaa Trust | $43,750 | |
| Previous Owner | Aaa Trust | $41,500 | |
| Previous Owner | Aaa Trust | $11,000 | |
| Previous Owner | Aaa Trust | $11,000 |
Source: Public Records
Tax History
| Year | Tax Paid | Tax Assessment Tax Assessment Total Assessment is a certain percentage of the fair market value that is determined by local assessors to be the total taxable value of land and additions on the property. | Land | Improvement |
|---|---|---|---|---|
| 2025 | $3,173 | $202,074 | -- | -- |
| 2024 | $2,711 | $183,704 | -- | -- |
| 2023 | $2,711 | $197,031 | $80,000 | $117,031 |
| 2022 | $2,447 | $178,406 | $80,000 | $98,406 |
| 2021 | $2,201 | $151,344 | $65,000 | $86,344 |
| 2020 | $1,882 | $127,043 | $40,000 | $87,043 |
| 2019 | $1,840 | $122,742 | $35,000 | $87,742 |
| 2018 | $1,535 | $92,048 | $25,000 | $67,048 |
| 2017 | $1,582 | $95,317 | $30,000 | $65,317 |
| 2016 | $1,032 | $62,477 | $12,000 | $50,477 |
| 2015 | $946 | $57,794 | $9,000 | $48,794 |
| 2014 | $840 | $48,278 | $9,000 | $39,278 |
Source: Public Records
Map
Nearby Homes
- 23 E Skylark St
- 1039 Eagles Forrest Dr
- O E Nancy Lee Ln
- 386 Chinahill Ct
- 1233 Rock Springs Rd
- 1265 Rock Springs Rd
- 1188 Foxforrest Cir
- 1227 Foxforrest Cir
- 225 Lancer Oak Dr
- 1240 Falconcrest Blvd
- 1048 Ustler Rd
- 1379 Osprey Way
- 303 Evergreen Ct
- 243 Martin St
- 1315 Falconwood Ct
- 314 Lancer Oak Dr
- 750 Welch Hill Cir
- 344 Martin St
- 640 Summit River Dr
- 660 Summit River Dr
- 23 E Thrush St
- 28 E Bob White St
- 24 E Bob White St
- 19 E Thrush St
- 26 E Thrush St
- 22 E Thrush St
- 20 E Bob White St
- 30 E Thrush St
- 15 E Thrush St
- 18 E Thrush St
- 16 E Bob White St
- 14 E Thrush St
- 29 E Bob White St
- 27 E Nightingale St
- 23 E Nightingale St
- 25 E Bob White St
- 12 E Bob White St
- 33 E Bob White St
- 31 E Nightingale St
Your Personal Tour Guide
Ask me questions while you tour the home.