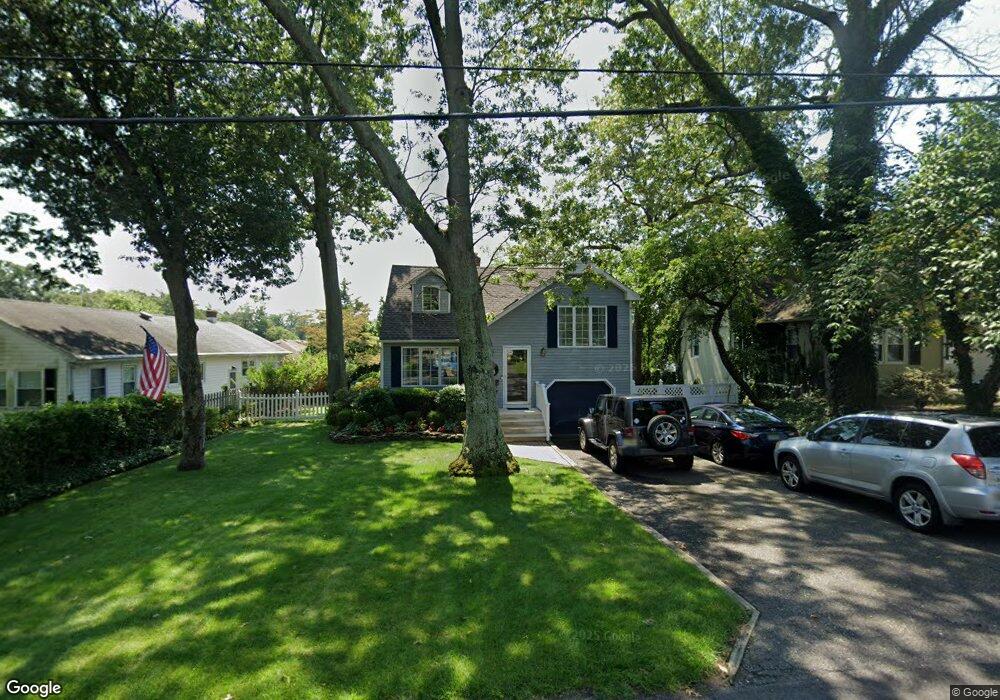
27 East Dr Toms River, NJ 08753
Estimated Value: $491,085 - $581,000
3
Beds
1
Bath
1,352
Sq Ft
$406/Sq Ft
Est. Value
About This Home
This home is located at 27 East Dr, Toms River, NJ 08753 and is currently estimated at $548,771, approximately $405 per square foot. 27 East Dr is a home located in Ocean County with nearby schools including St Joseph Grade School, Ambassador Christian Academy, and Donovan Catholic High School.
Ownership History
Date
Name
Owned For
Owner Type
Purchase Details
Closed on
Aug 19, 2009
Sold by
Harrington Colleen M and Weidenbush Colleen M
Bought by
Gillespie James and Akle Christine
Current Estimated Value
Home Financials for this Owner
Home Financials are based on the most recent Mortgage that was taken out on this home.
Original Mortgage
$336,950
Outstanding Balance
$219,244
Interest Rate
5.17%
Mortgage Type
VA
Estimated Equity
$329,527
Purchase Details
Closed on
Apr 16, 2002
Sold by
Brouwer Allen
Bought by
Weidenbush Colleen
Home Financials for this Owner
Home Financials are based on the most recent Mortgage that was taken out on this home.
Original Mortgage
$149,900
Interest Rate
6.85%
Purchase Details
Closed on
Jul 2, 1999
Sold by
Coratti Anthony and Coratti Christine S
Bought by
Broumer Allen K
Create a Home Valuation Report for This Property
The Home Valuation Report is an in-depth analysis detailing your home's value as well as a comparison with similar homes in the area
Home Values in the Area
Average Home Value in this Area
Purchase History
| Date | Buyer | Sale Price | Title Company |
|---|---|---|---|
| Gillespie James | $329,900 | None Available | |
| Weidenbush Colleen | $209,900 | -- | |
| Broumer Allen K | $149,900 | -- |
Source: Public Records
Mortgage History
| Date | Status | Borrower | Loan Amount |
|---|---|---|---|
| Open | Gillespie James | $336,950 | |
| Previous Owner | Weidenbush Colleen | $149,900 |
Source: Public Records
Tax History Compared to Growth
Tax History
| Year | Tax Paid | Tax Assessment Tax Assessment Total Assessment is a certain percentage of the fair market value that is determined by local assessors to be the total taxable value of land and additions on the property. | Land | Improvement |
|---|---|---|---|---|
| 2025 | $5,625 | $308,900 | $188,000 | $120,900 |
| 2024 | $5,097 | $308,900 | $188,000 | $120,900 |
| 2023 | $4,906 | $308,900 | $188,000 | $120,900 |
| 2022 | $5,156 | $308,900 | $188,000 | $120,900 |
| 2021 | $4,259 | $180,000 | $84,500 | $95,500 |
| 2020 | $4,489 | $180,000 | $84,500 | $95,500 |
| 2019 | $4,295 | $180,000 | $84,500 | $95,500 |
| 2018 | $4,237 | $180,000 | $84,500 | $95,500 |
| 2017 | $4,201 | $180,000 | $84,500 | $95,500 |
| 2016 | $3,841 | $180,000 | $84,500 | $95,500 |
| 2015 | $3,687 | $180,000 | $84,500 | $95,500 |
| 2014 | $3,498 | $180,000 | $84,500 | $95,500 |
Source: Public Records
Map
Nearby Homes
- 18 East Dr
- 14 Laurel Ave
- 130 Cranmoor Dr
- 802 Washington St
- 21 Cedar Dr Unit A
- 108 Pine St
- 543 Clifton Ave
- 118 Point o Woods Dr
- 16 Dickinson Ave
- 511 Batchelor St
- 505 Batchelor St
- 548 Hill Rd
- 693 Clifton Ave
- 59 Grand Ave
- 508 Lafayette Ave
- 55 Grand Ave
- 507 Terrace Ave
- 547 Brookside Dr
- 205 Dewey Dr Unit Pic your finish colo
- 308 Washington St