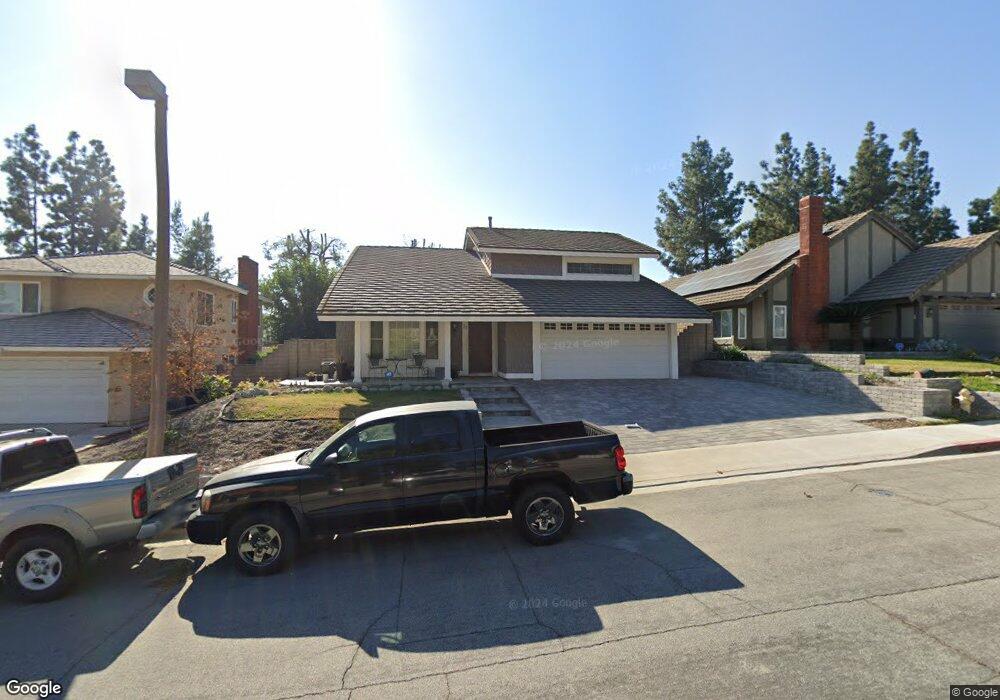
27 Edgebrook Dr Pomona, CA 91766
Estimated Value: $888,370 - $962,000
4
Beds
3
Baths
2,052
Sq Ft
$451/Sq Ft
Est. Value
About This Home
This home is located at 27 Edgebrook Dr, Pomona, CA 91766 and is currently estimated at $926,343, approximately $451 per square foot. 27 Edgebrook Dr is a home located in Los Angeles County with nearby schools including Decker Elementary, Lorbeer Middle School, and Diamond Ranch High School.
Ownership History
Date
Name
Owned For
Owner Type
Purchase Details
Closed on
Apr 23, 1999
Sold by
Va
Bought by
Enriquez Anthony Gabriel and Enriquez Anna Maria
Current Estimated Value
Home Financials for this Owner
Home Financials are based on the most recent Mortgage that was taken out on this home.
Original Mortgage
$217,100
Outstanding Balance
$54,608
Interest Rate
6.96%
Mortgage Type
Seller Take Back
Estimated Equity
$871,735
Purchase Details
Closed on
Nov 6, 1998
Sold by
Norwest Mtg Inc
Bought by
Va
Purchase Details
Closed on
Oct 28, 1998
Sold by
Llamera Melvin R
Bought by
Norwest Mtg Inc
Purchase Details
Closed on
Jul 9, 1993
Sold by
Federal Home Loan Mortgage Corporation
Bought by
Llamera Melvin R and Llamera Emelda B
Home Financials for this Owner
Home Financials are based on the most recent Mortgage that was taken out on this home.
Original Mortgage
$183,262
Interest Rate
7.2%
Mortgage Type
Assumption
Create a Home Valuation Report for This Property
The Home Valuation Report is an in-depth analysis detailing your home's value as well as a comparison with similar homes in the area
Home Values in the Area
Average Home Value in this Area
Purchase History
| Date | Buyer | Sale Price | Title Company |
|---|---|---|---|
| Enriquez Anthony Gabriel | $217,500 | United Title Company | |
| Va | -- | Benefit Land Title Company | |
| Norwest Mtg Inc | $167,758 | Benefit Land Title Ins Co | |
| Llamera Melvin R | $181,000 | Fidelity National Title Comp |
Source: Public Records
Mortgage History
| Date | Status | Borrower | Loan Amount |
|---|---|---|---|
| Open | Enriquez Anthony Gabriel | $217,100 | |
| Previous Owner | Llamera Melvin R | $183,262 |
Source: Public Records
Tax History Compared to Growth
Tax History
| Year | Tax Paid | Tax Assessment Tax Assessment Total Assessment is a certain percentage of the fair market value that is determined by local assessors to be the total taxable value of land and additions on the property. | Land | Improvement |
|---|---|---|---|---|
| 2025 | $4,748 | $340,325 | $125,404 | $214,921 |
| 2024 | $4,748 | $333,653 | $122,946 | $210,707 |
| 2023 | $4,660 | $327,112 | $120,536 | $206,576 |
| 2022 | $4,591 | $320,699 | $118,173 | $202,526 |
| 2021 | $4,488 | $314,411 | $115,856 | $198,555 |
| 2019 | $4,576 | $305,088 | $112,421 | $192,667 |
| 2018 | $4,226 | $299,107 | $110,217 | $188,890 |
| 2016 | $3,974 | $287,494 | $105,938 | $181,556 |
| 2015 | $3,943 | $283,176 | $104,347 | $178,829 |
| 2014 | $3,920 | $277,629 | $102,303 | $175,326 |
Source: Public Records
Map
Nearby Homes
- 19 Black Oak Dr
- 63 Carriage Way Unit 239
- 81 Carriage Way Unit 221
- 7 Town And Country Rd
- 4 Turn Post Ln
- 47 Town And Country Rd
- 22 Country Mile Rd
- 44 Carriage Way Unit 108
- 5 Country Mile Rd
- 26 Blackbird Ln
- 8 Vista Ct
- 15 Greensboro Ct
- 51 Rolling Hills Dr
- 54 Falcon Ridge Dr
- 11 Rising Hill Rd
- 19 Viewpoint Cir
- 15 Goldstar Place
- 46 Country Wood Dr
- 23 Country Ridge Rd
- 7 Wilderness Place Unit 49
- 29 Edgebrook Dr
- 25 Edgebrook Dr
- 31 Edgebrook Dr
- 23 Edgebrook Dr
- 20 Cedarwood Dr
- 22 Cedarwood Dr
- 18 Cedarwood Dr
- 24 Cedarwood Dr
- 21 Edgebrook Dr
- 28 Edgebrook Dr
- 30 Edgebrook Dr
- 16 Cedarwood Dr
- 26 Cedarwood Dr
- 35 Edgebrook Dr
- 26 Edgebrook Dr
- 32 Edgebrook Dr
- 19 Edgebrook Dr
- 14 Cedarwood Dr
- 28 Cedarwood Dr
- 34 Edgebrook Dr