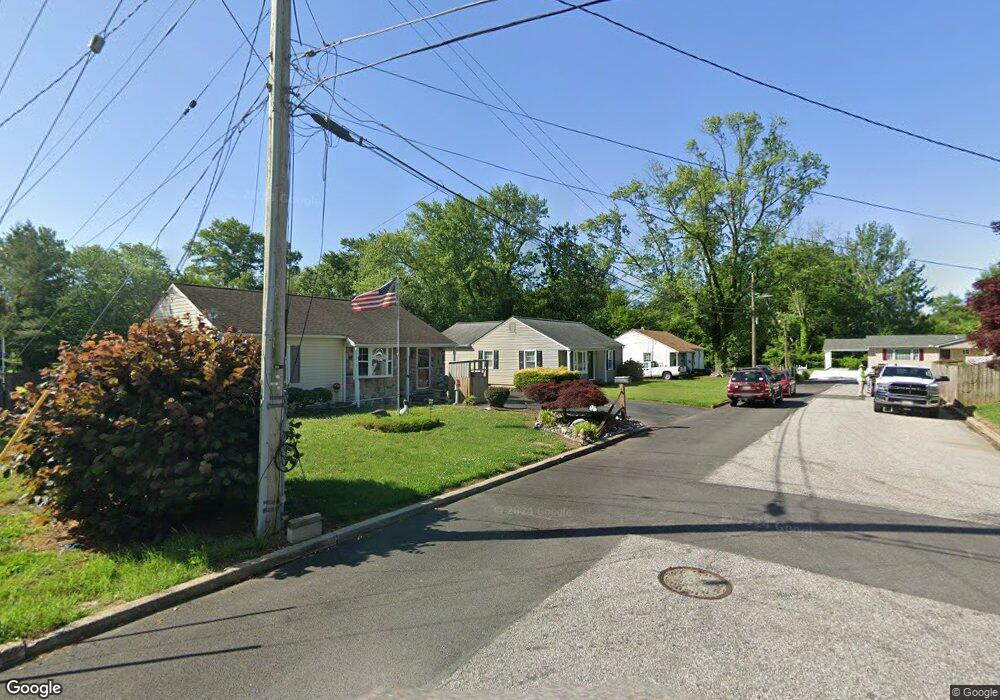
27 Emerson St Aberdeen, MD 21001
Estimated Value: $224,000 - $236,000
--
Bed
1
Bath
1,080
Sq Ft
$215/Sq Ft
Est. Value
About This Home
This home is located at 27 Emerson St, Aberdeen, MD 21001 and is currently estimated at $231,924, approximately $214 per square foot. 27 Emerson St is a home located in Harford County with nearby schools including Halls Cross Roads Elementary School, Aberdeen Middle School, and Aberdeen High School.
Ownership History
Date
Name
Owned For
Owner Type
Purchase Details
Closed on
Feb 2, 2004
Sold by
Fleming Jon E
Bought by
Fleming Jon E
Current Estimated Value
Purchase Details
Closed on
Jul 18, 2002
Sold by
Fleming Jon E
Bought by
Fleming Jon E
Purchase Details
Closed on
Jan 3, 1997
Sold by
Cann James Roosevelt
Bought by
Fleming Jon E and Fleming Lissa C
Purchase Details
Closed on
Nov 29, 1985
Sold by
Brown Alice M
Bought by
Cann James Roosevelt
Home Financials for this Owner
Home Financials are based on the most recent Mortgage that was taken out on this home.
Original Mortgage
$51,200
Interest Rate
11.58%
Create a Home Valuation Report for This Property
The Home Valuation Report is an in-depth analysis detailing your home's value as well as a comparison with similar homes in the area
Home Values in the Area
Average Home Value in this Area
Purchase History
| Date | Buyer | Sale Price | Title Company |
|---|---|---|---|
| Fleming Jon E | -- | -- | |
| Fleming Jon E | -- | -- | |
| Fleming Jon E | $85,000 | -- | |
| Cann James Roosevelt | $50,000 | -- |
Source: Public Records
Mortgage History
| Date | Status | Borrower | Loan Amount |
|---|---|---|---|
| Previous Owner | Cann James Roosevelt | $51,200 | |
| Closed | Fleming Jon E | -- |
Source: Public Records
Tax History Compared to Growth
Tax History
| Year | Tax Paid | Tax Assessment Tax Assessment Total Assessment is a certain percentage of the fair market value that is determined by local assessors to be the total taxable value of land and additions on the property. | Land | Improvement |
|---|---|---|---|---|
| 2025 | $1,211 | $144,900 | $0 | $0 |
| 2024 | $1,211 | $132,600 | $0 | $0 |
| 2023 | $1,147 | $120,300 | $46,700 | $73,600 |
| 2022 | $1,146 | $120,233 | $0 | $0 |
| 2021 | $1,208 | $120,167 | $0 | $0 |
| 2020 | $1,208 | $120,100 | $46,700 | $73,400 |
| 2019 | $1,208 | $120,100 | $46,700 | $73,400 |
| 2018 | $1,197 | $120,100 | $46,700 | $73,400 |
| 2017 | $1,201 | $120,500 | $0 | $0 |
| 2016 | -- | $120,500 | $0 | $0 |
| 2015 | $1,338 | $120,500 | $0 | $0 |
| 2014 | $1,338 | $125,600 | $0 | $0 |
Source: Public Records
Map
Nearby Homes