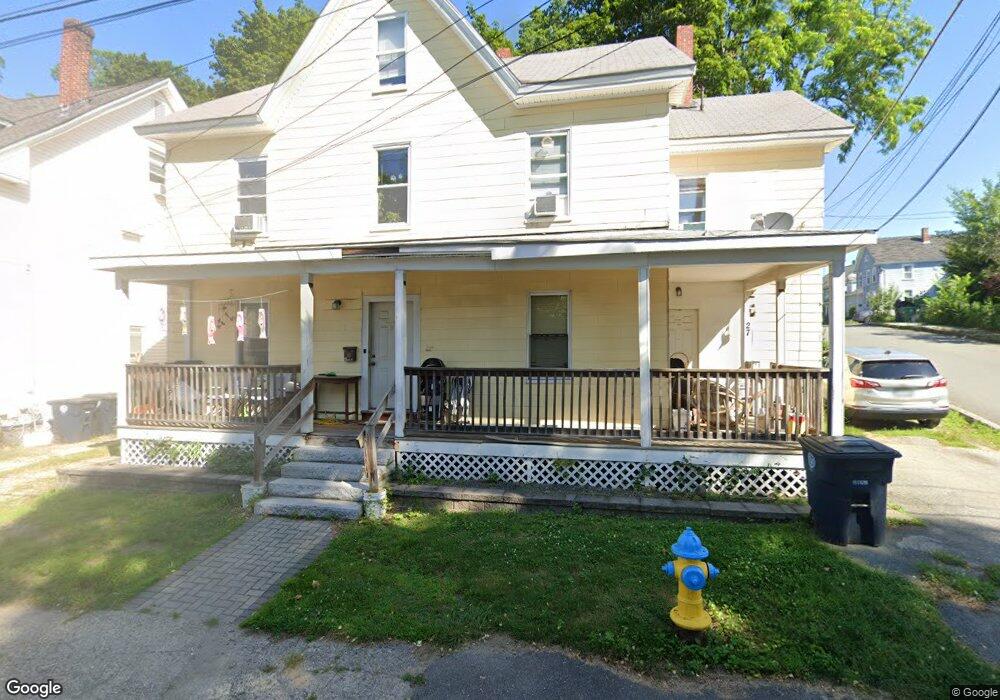
27 Fletcher St Nashua, NH 03064
North End Nashua NeighborhoodEstimated Value: $540,003 - $568,000
10
Beds
3
Baths
2,485
Sq Ft
$222/Sq Ft
Est. Value
About This Home
This home is located at 27 Fletcher St, Nashua, NH 03064 and is currently estimated at $551,251, approximately $221 per square foot. 27 Fletcher St is a home located in Hillsborough County with nearby schools including Amherst Street School, Pennichuck Middle School, and Nashua High School North.
Ownership History
Date
Name
Owned For
Owner Type
Purchase Details
Closed on
Dec 7, 2009
Sold by
Homesales Inc
Bought by
Nadeau Brian and Nadeau Lori
Current Estimated Value
Home Financials for this Owner
Home Financials are based on the most recent Mortgage that was taken out on this home.
Original Mortgage
$76,500
Outstanding Balance
$49,977
Interest Rate
5.01%
Mortgage Type
Purchase Money Mortgage
Estimated Equity
$501,274
Purchase Details
Closed on
Oct 10, 2008
Sold by
Alcerro Ilvia U and Jp Morgan Chase Bank N
Bought by
Homesales Inc
Purchase Details
Closed on
May 4, 2001
Sold by
Sillerico Javier
Bought by
Alcerro Ilvia and Alcerro Luis
Home Financials for this Owner
Home Financials are based on the most recent Mortgage that was taken out on this home.
Original Mortgage
$138,613
Interest Rate
6.85%
Mortgage Type
Purchase Money Mortgage
Purchase Details
Closed on
Sep 26, 2000
Sold by
Zee Pui Kee
Bought by
Sillerico Javier
Home Financials for this Owner
Home Financials are based on the most recent Mortgage that was taken out on this home.
Original Mortgage
$101,800
Interest Rate
8%
Mortgage Type
Purchase Money Mortgage
Create a Home Valuation Report for This Property
The Home Valuation Report is an in-depth analysis detailing your home's value as well as a comparison with similar homes in the area
Home Values in the Area
Average Home Value in this Area
Purchase History
| Date | Buyer | Sale Price | Title Company |
|---|---|---|---|
| Nadeau Brian | $102,000 | -- | |
| Homesales Inc | $104,300 | -- | |
| Alcerro Ilvia | $142,900 | -- | |
| Sillerico Javier | $105,000 | -- |
Source: Public Records
Mortgage History
| Date | Status | Borrower | Loan Amount |
|---|---|---|---|
| Open | Sillerico Javier | $76,500 | |
| Previous Owner | Sillerico Javier | $232,000 | |
| Previous Owner | Sillerico Javier | $138,613 | |
| Previous Owner | Sillerico Javier | $101,800 |
Source: Public Records
Tax History Compared to Growth
Tax History
| Year | Tax Paid | Tax Assessment Tax Assessment Total Assessment is a certain percentage of the fair market value that is determined by local assessors to be the total taxable value of land and additions on the property. | Land | Improvement |
|---|---|---|---|---|
| 2024 | $7,309 | $459,700 | $113,300 | $346,400 |
| 2023 | $6,838 | $375,100 | $90,600 | $284,500 |
| 2022 | $6,778 | $375,100 | $90,600 | $284,500 |
| 2021 | $5,782 | $249,000 | $57,400 | $191,600 |
| 2020 | $5,614 | $248,300 | $57,400 | $190,900 |
| 2019 | $5,403 | $248,300 | $57,400 | $190,900 |
| 2018 | $5,266 | $248,300 | $57,400 | $190,900 |
| 2017 | $4,487 | $174,000 | $60,600 | $113,400 |
| 2016 | $4,362 | $174,000 | $60,600 | $113,400 |
| 2015 | $4,268 | $174,000 | $60,600 | $113,400 |
| 2014 | $4,185 | $174,000 | $60,600 | $113,400 |
Source: Public Records
Map
Nearby Homes
- 11 Charles St
- 0 Baldwin St
- 38 Central St
- 7 Bitirnas St Unit U7
- 30 Ledge St
- 36-38 Courtland St
- 5 Mulberry St
- 4 Reservoir St
- 61 Manchester St
- 8 Buck St Unit 10
- 71 Concord St
- 22 Wilder St
- 4 Badger St
- 18 Harbor Ave Unit 208
- 11 Amherst Terrace
- 29 Wilder St
- 32-34 Grand Ave
- 13 Sapphire Ln
- 15 Atherton Ave
- 19 Atherton Ave
- 27 1/2 Fletcher St
- 29 Fletcher St Unit 31
- 4 Beard St
- 1 1/2 Beard St
- 1 Beard St Unit 31
- 33 Fletcher St
- 30 Fletcher St
- 9 Green St
- 3 Beard St
- 7 Green St
- 1-1.5 Beard St
- 5 Beard St
- 23 Fletcher St
- 23 Fletcher St Unit A & B
- 23 Fletcher St Unit 23 C
- 14 Auburn St Unit 14A
- 10 Green St
- 10 Auburn St
- 12 Auburn St Unit 4151
- 8 Green St