Estimated Value: $772,495 - $1,014,000
3
Beds
3
Baths
2,952
Sq Ft
$312/Sq Ft
Est. Value
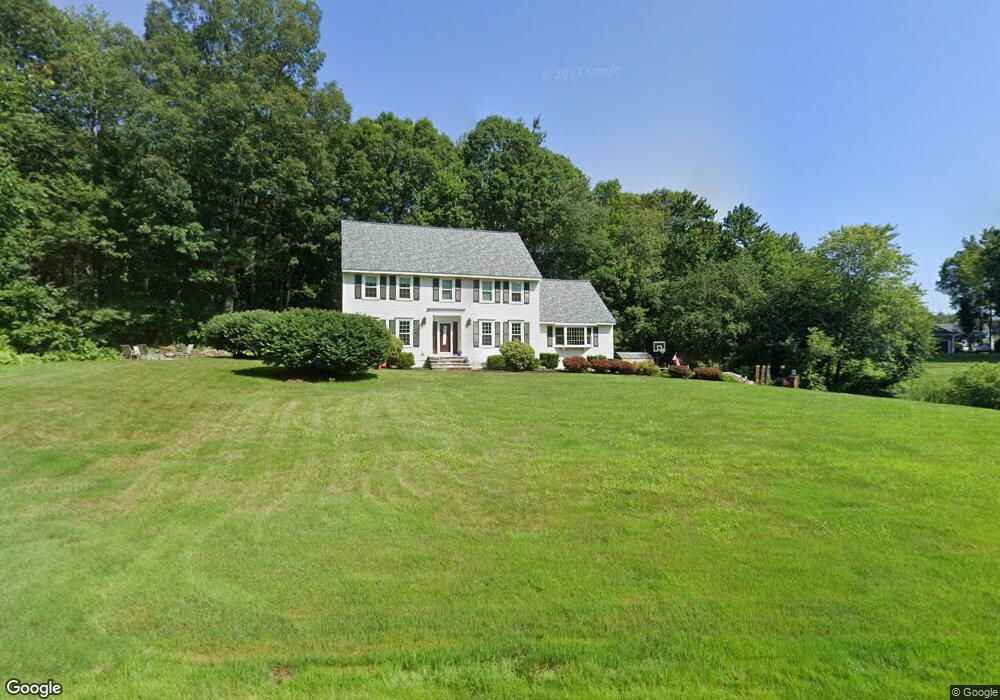
About This Home
This home is located at 27 Fox Run Ln, Salem, NH 03079 and is currently estimated at $922,124, approximately $312 per square foot. 27 Fox Run Ln is a home located in Rockingham County with nearby schools including North Salem Elementary School, Woodbury School, and Salem High School.
Ownership History
Date
Name
Owned For
Owner Type
Purchase Details
Closed on
Jul 30, 2009
Sold by
Augusta Vito T and Augusta Joan A
Bought by
Chartrain Steven C and Chartrain Amy E
Current Estimated Value
Home Financials for this Owner
Home Financials are based on the most recent Mortgage that was taken out on this home.
Original Mortgage
$314,900
Interest Rate
5.43%
Mortgage Type
Purchase Money Mortgage
Create a Home Valuation Report for This Property
The Home Valuation Report is an in-depth analysis detailing your home's value as well as a comparison with similar homes in the area
Home Values in the Area
Average Home Value in this Area
Purchase History
| Date | Buyer | Sale Price | Title Company |
|---|---|---|---|
| Chartrain Steven C | $414,900 | -- |
Source: Public Records
Mortgage History
| Date | Status | Borrower | Loan Amount |
|---|---|---|---|
| Open | Chartrain Steven C | $316,000 | |
| Closed | Chartrain Steven C | $324,800 | |
| Closed | Chartrain Steven C | $324,800 | |
| Closed | Chartrain Steven C | $314,900 |
Source: Public Records
Tax History Compared to Growth
Tax History
| Year | Tax Paid | Tax Assessment Tax Assessment Total Assessment is a certain percentage of the fair market value that is determined by local assessors to be the total taxable value of land and additions on the property. | Land | Improvement |
|---|---|---|---|---|
| 2024 | $10,622 | $603,500 | $219,800 | $383,700 |
| 2023 | $10,235 | $603,500 | $219,800 | $383,700 |
| 2022 | $9,686 | $603,500 | $219,800 | $383,700 |
| 2021 | $9,644 | $603,500 | $219,800 | $383,700 |
| 2020 | $9,497 | $431,300 | $157,300 | $274,000 |
| 2019 | $9,480 | $431,300 | $157,300 | $274,000 |
| 2018 | $9,320 | $431,300 | $157,300 | $274,000 |
| 2017 | $8,988 | $431,300 | $157,300 | $274,000 |
| 2016 | $8,811 | $431,300 | $157,300 | $274,000 |
| 2015 | $8,045 | $376,100 | $155,100 | $221,000 |
| 2014 | $7,819 | $376,100 | $155,100 | $221,000 |
| 2013 | $7,695 | $376,100 | $155,100 | $221,000 |
Source: Public Records
Map
Nearby Homes
- 27 Norwood Rd
- 3 Providence Hill Rd
- 10 Independence Dr
- 21 Teague Dr
- 5 Betty Ln
- 41 Westside Dr
- 7 Oak Ridge Dr
- 136 Shore Dr
- 22 Nolet Ave
- 34 Shore Dr
- 60 Shore Dr
- 82 Shore Dr
- 10 Old Coach Rd
- 7 Longview Dr Unit 105
- Massabesic Plan at Atkinson Heights
- Jenness Plan at Atkinson Heights
- Gloucester Plan at Atkinson Heights
- Berkshire Plan at Atkinson Heights
- Allagash Plan at Atkinson Heights
- Franconia Plan at Atkinson Heights