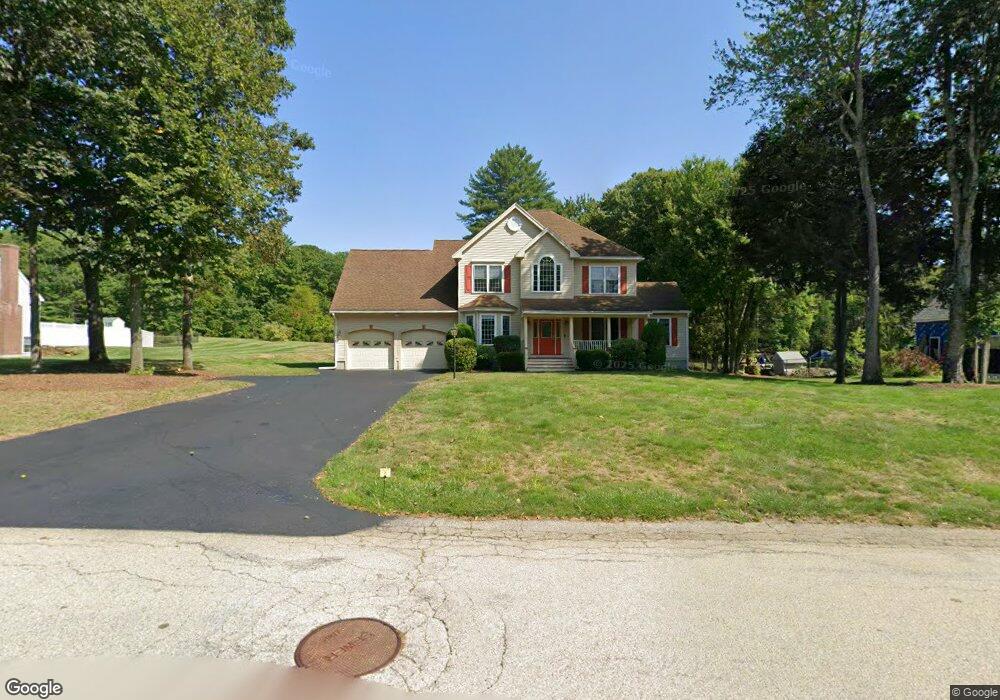
27 Hadley Rd Pepperell, MA 01463
Estimated Value: $777,637 - $838,000
4
Beds
3
Baths
2,926
Sq Ft
$279/Sq Ft
Est. Value
About This Home
This home is located at 27 Hadley Rd, Pepperell, MA 01463 and is currently estimated at $817,409, approximately $279 per square foot. 27 Hadley Rd is a home located in Middlesex County with nearby schools including North Middlesex Regional High School, Pepperell Christian Academy, and Maple Dene & Moppet School.
Ownership History
Date
Name
Owned For
Owner Type
Purchase Details
Closed on
Feb 27, 2025
Sold by
Beg Mirza A and Beg Aliya
Bought by
Mirza A & Aliya Beg Ft and Beg
Current Estimated Value
Purchase Details
Closed on
Jan 24, 2001
Sold by
Homestead Real Prop
Bought by
Beg Mirza A and Beg Aliya
Create a Home Valuation Report for This Property
The Home Valuation Report is an in-depth analysis detailing your home's value as well as a comparison with similar homes in the area
Home Values in the Area
Average Home Value in this Area
Purchase History
| Date | Buyer | Sale Price | Title Company |
|---|---|---|---|
| Mirza A & Aliya Beg Ft | -- | None Available | |
| Mirza A & Aliya Beg Ft | -- | None Available | |
| Beg Mirza A | $416,814 | -- |
Source: Public Records
Mortgage History
| Date | Status | Borrower | Loan Amount |
|---|---|---|---|
| Previous Owner | Beg Mirza A | $304,000 | |
| Previous Owner | Beg Mirza A | $310,000 | |
| Previous Owner | Beg Mirza A | $312,000 | |
| Previous Owner | Beg Mirza A | $312,000 |
Source: Public Records
Tax History
| Year | Tax Paid | Tax Assessment Tax Assessment Total Assessment is a certain percentage of the fair market value that is determined by local assessors to be the total taxable value of land and additions on the property. | Land | Improvement |
|---|---|---|---|---|
| 2025 | $10,573 | $722,700 | $232,000 | $490,700 |
| 2024 | $9,639 | $671,700 | $212,000 | $459,700 |
| 2023 | $9,438 | $623,400 | $192,000 | $431,400 |
| 2022 | $9,150 | $533,500 | $152,000 | $381,500 |
| 2021 | $8,784 | $490,200 | $128,000 | $362,200 |
| 2020 | $4,332 | $496,300 | $128,000 | $368,300 |
| 2019 | $4,254 | $457,500 | $128,000 | $329,500 |
| 2018 | $4,615 | $439,300 | $128,000 | $311,300 |
| 2017 | $6,790 | $422,600 | $120,000 | $302,600 |
| 2016 | $6,658 | $402,800 | $120,000 | $282,800 |
| 2015 | $6,425 | $402,800 | $120,000 | $282,800 |
| 2014 | $6,350 | $400,400 | $124,000 | $276,400 |
Source: Public Records
Map
Nearby Homes
- 8 Casie Ln
- 27 Merrimac Dr
- 14 Brookline St
- 39 Hollis St Unit A
- 28-30 Groton St
- 38 Tarbell St Unit 5B
- 38 Tarbell St Unit 1D
- 29 Tarbell St
- 147 Nashua Rd
- 113-115 Main St
- 11 Unkety Brook Way
- 12 Unkety Brook Way
- 38 River Rd Unit 11
- 114 Groton St
- 4 Southgate Rd
- 13 Birch Dr
- 77 Birchwood Dr
- 208 North St
- 179 Wyman Rd
- 194 Dow Rd
Your Personal Tour Guide
Ask me questions while you tour the home.