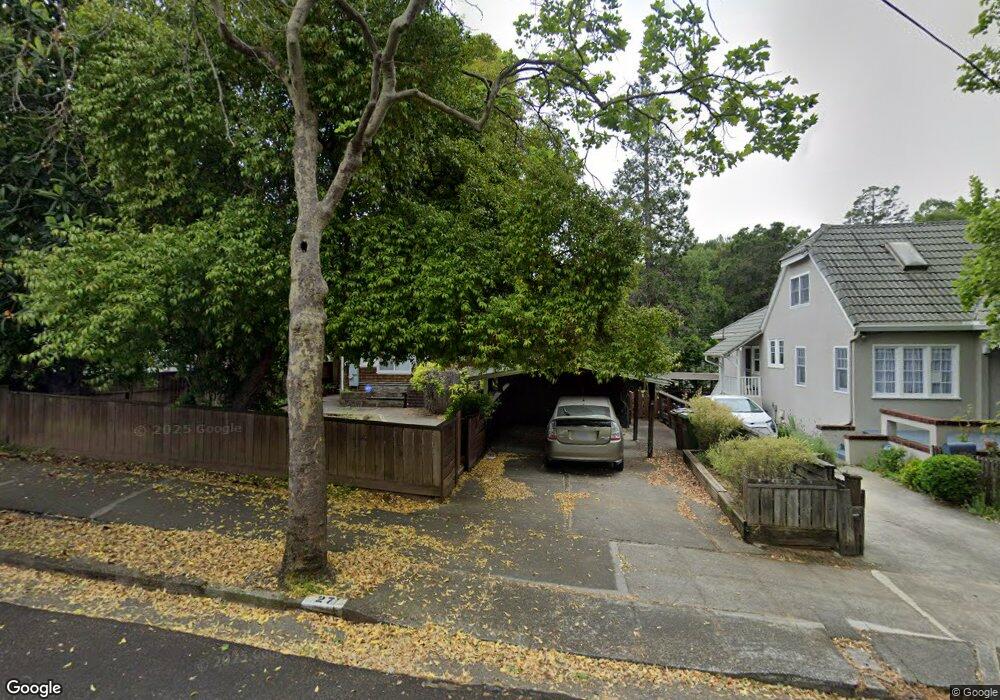
27 Harcourt St San Rafael, CA 94901
Sun Valley NeighborhoodEstimated Value: $1,025,284 - $1,635,000
3
Beds
1
Bath
1,216
Sq Ft
$1,104/Sq Ft
Est. Value
About This Home
This home is located at 27 Harcourt St, San Rafael, CA 94901 and is currently estimated at $1,342,071, approximately $1,103 per square foot. 27 Harcourt St is a home located in Marin County with nearby schools including Sun Valley Elementary School, James B. Davidson Middle School, and San Rafael High School.
Ownership History
Date
Name
Owned For
Owner Type
Purchase Details
Closed on
May 19, 2010
Sold by
Crane David W and Crane Anne
Bought by
Crane David W and Crane Anne K
Current Estimated Value
Purchase Details
Closed on
Dec 23, 2009
Sold by
Crane David W and Crane Anne K
Bought by
Crane David W and Crane Anne
Purchase Details
Closed on
Jul 30, 2008
Sold by
Crane David W and Crane Anne K
Bought by
Crane David W and Crane Anne K
Home Financials for this Owner
Home Financials are based on the most recent Mortgage that was taken out on this home.
Original Mortgage
$417,000
Interest Rate
6.41%
Mortgage Type
New Conventional
Create a Home Valuation Report for This Property
The Home Valuation Report is an in-depth analysis detailing your home's value as well as a comparison with similar homes in the area
Home Values in the Area
Average Home Value in this Area
Purchase History
| Date | Buyer | Sale Price | Title Company |
|---|---|---|---|
| Crane David W | -- | None Available | |
| Crane David W | -- | None Available | |
| Crane David W | -- | Fidelity National Title Co |
Source: Public Records
Mortgage History
| Date | Status | Borrower | Loan Amount |
|---|---|---|---|
| Closed | Crane David W | $417,000 |
Source: Public Records
Tax History Compared to Growth
Tax History
| Year | Tax Paid | Tax Assessment Tax Assessment Total Assessment is a certain percentage of the fair market value that is determined by local assessors to be the total taxable value of land and additions on the property. | Land | Improvement |
|---|---|---|---|---|
| 2025 | $5,734 | $320,145 | $192,087 | $128,058 |
| 2024 | $5,734 | $313,870 | $188,322 | $125,548 |
| 2023 | $5,572 | $307,717 | $184,630 | $123,087 |
| 2022 | $5,319 | $301,683 | $181,010 | $120,673 |
| 2021 | $5,235 | $295,770 | $177,462 | $118,308 |
| 2020 | $5,143 | $292,726 | $175,637 | $117,089 |
| 2019 | $4,923 | $286,987 | $172,193 | $114,794 |
| 2018 | $4,868 | $281,360 | $168,817 | $112,543 |
| 2017 | $4,705 | $275,845 | $165,508 | $110,337 |
| 2016 | $4,531 | $270,437 | $162,263 | $108,174 |
| 2015 | $4,334 | $266,375 | $159,826 | $106,549 |
| 2014 | $4,134 | $261,157 | $156,695 | $104,462 |
Source: Public Records
Map
Nearby Homes