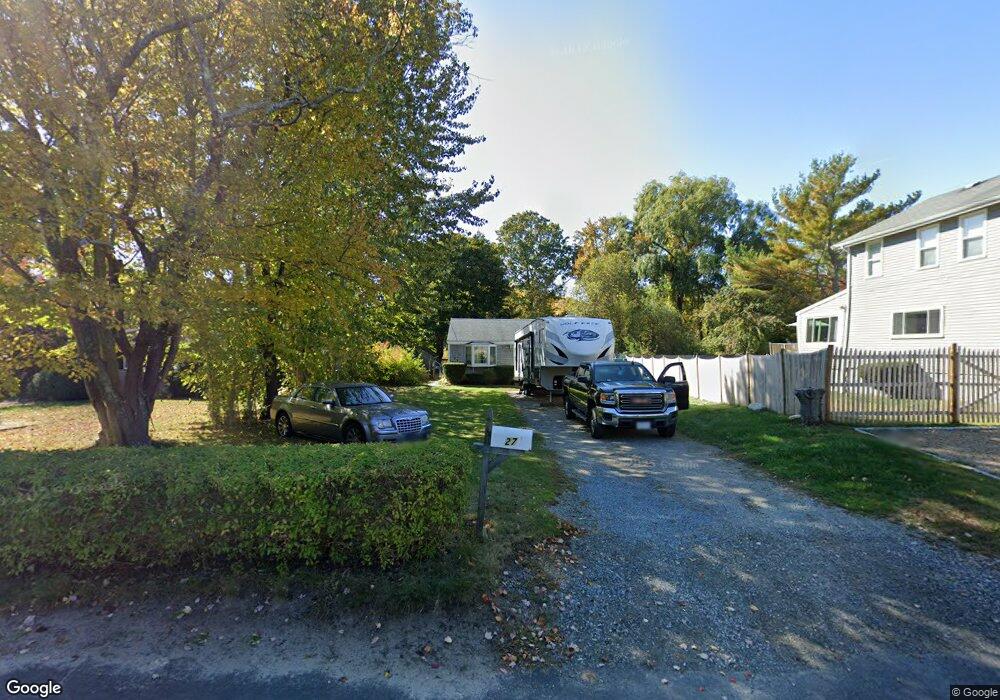
27 Hatherly Rd Scituate, MA 02066
Estimated Value: $631,000 - $722,000
2
Beds
1
Bath
864
Sq Ft
$768/Sq Ft
Est. Value
About This Home
This home is located at 27 Hatherly Rd, Scituate, MA 02066 and is currently estimated at $663,933, approximately $768 per square foot. 27 Hatherly Rd is a home located in Plymouth County with nearby schools including Jenkins Elementary School, Lester J. Gates Middle School, and Scituate High School.
Ownership History
Date
Name
Owned For
Owner Type
Purchase Details
Closed on
Mar 28, 2024
Sold by
Holland Jeaneen
Bought by
Holland Jeaneen and Holland Francisco J
Current Estimated Value
Purchase Details
Closed on
Oct 9, 2019
Sold by
Holland Joseph E and Holland Francisco J
Bought by
Holland Jeaneen
Home Financials for this Owner
Home Financials are based on the most recent Mortgage that was taken out on this home.
Original Mortgage
$288,000
Interest Rate
3.5%
Mortgage Type
New Conventional
Purchase Details
Closed on
Jan 5, 2016
Sold by
Holland 3Rd Joseph E and Holland Erlinda S
Bought by
Holland 3Rd Joseph E and Holland Erlinda S
Create a Home Valuation Report for This Property
The Home Valuation Report is an in-depth analysis detailing your home's value as well as a comparison with similar homes in the area
Home Values in the Area
Average Home Value in this Area
Purchase History
| Date | Buyer | Sale Price | Title Company |
|---|---|---|---|
| Holland Jeaneen | -- | None Available | |
| Holland Jeaneen | -- | None Available | |
| Holland Jeaneen | $360,000 | -- | |
| Holland 3Rd Joseph E | -- | -- | |
| Holland 3Rd Joseph E | -- | -- | |
| Holland 3Rd Joseph E | -- | -- |
Source: Public Records
Mortgage History
| Date | Status | Borrower | Loan Amount |
|---|---|---|---|
| Previous Owner | Holland Jeaneen | $288,000 | |
| Previous Owner | Holland 3Rd Joseph E | $176,000 | |
| Previous Owner | Holland 3Rd Joseph E | $86,000 |
Source: Public Records
Tax History
| Year | Tax Paid | Tax Assessment Tax Assessment Total Assessment is a certain percentage of the fair market value that is determined by local assessors to be the total taxable value of land and additions on the property. | Land | Improvement |
|---|---|---|---|---|
| 2025 | $5,677 | $568,300 | $393,400 | $174,900 |
| 2024 | $5,481 | $529,100 | $357,600 | $171,500 |
| 2023 | $4,929 | $442,100 | $325,100 | $117,000 |
| 2022 | $4,929 | $390,600 | $270,500 | $120,100 |
| 2021 | $4,599 | $345,000 | $244,700 | $100,300 |
| 2020 | $4,423 | $327,600 | $235,300 | $92,300 |
| 2019 | $4,368 | $317,900 | $230,700 | $87,200 |
| 2018 | $4,284 | $307,100 | $236,600 | $70,500 |
| 2017 | $4,182 | $296,800 | $226,300 | $70,500 |
| 2016 | $4,051 | $286,500 | $216,000 | $70,500 |
| 2015 | $3,618 | $276,200 | $205,700 | $70,500 |
Source: Public Records
Map
Nearby Homes
- 11 Brookline Rd
- 32 Barker Rd Unit 3
- 159 Turner Rd
- 76 A Brook St
- 76 A Brook St Unit 1
- 5 Brand Blvd Unit 5
- 44 Kane Dr
- 49 Jackson Rd
- 55 Crescent Ave
- 3 Egypt Ave
- 74 Branch St Unit 15
- 59 Greenfield Ln
- 20 Grace Way Unit 20
- 6 Grace Way Unit 6
- 1 Grace Way Unit 1
- 25 Grace Way
- 63 Seaside Rd
- 386 Country Way
- 18 Hillside Rd
- 6 Wheeler Ave
- 25 Hatherly Rd
- 29 Hatherly Rd
- 31 Hatherly Rd
- 23 Hatherly Rd
- 21 Hatherly Rd
- 21 Hatherly Rd Unit 1
- 23 Hatherly Rd Unit D
- 28 Hatherly Rd
- 33 Hatherly Rd
- 32 Hatherly Rd
- 32 Hatherly Rd
- 32 Hatherly Rd Unit 2
- 32 Hatherly Rd Unit 1
- 32 Hatherly Rd Unit 2
- 17 Stewart Place
- 19 Stewart Place
- 35 Hatherly Rd
- 13 Hatherly Rd
- 22 Hatherly Rd
- 11 Hatherly Rd
Your Personal Tour Guide
Ask me questions while you tour the home.