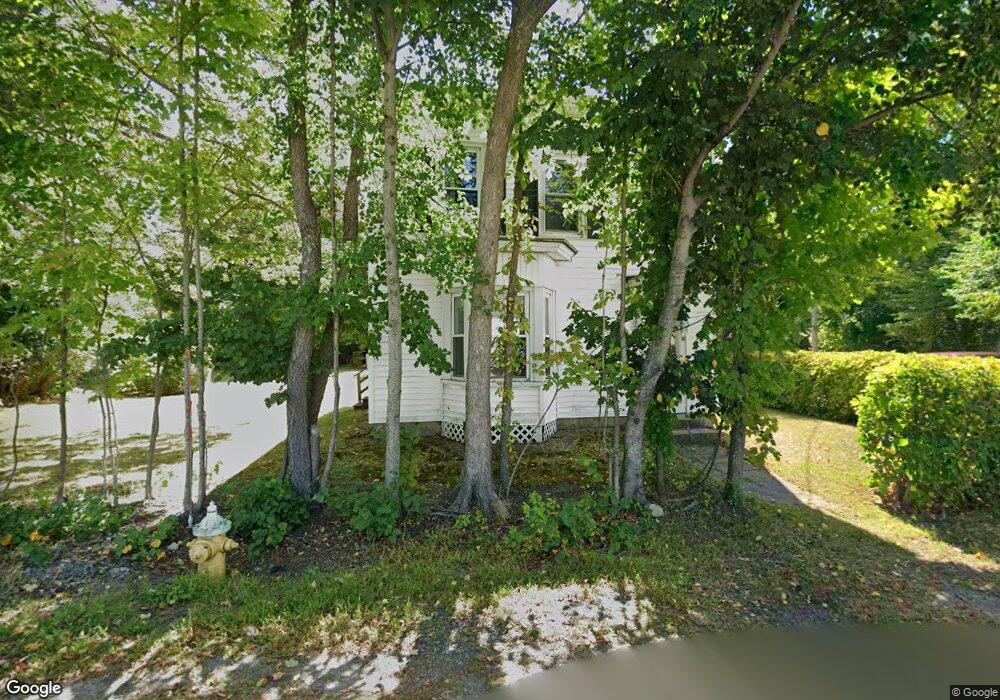
27 Highland St Townsend, MA 01469
Estimated Value: $268,000 - $610,000
4
Beds
2
Baths
2,260
Sq Ft
$192/Sq Ft
Est. Value
About This Home
This home is located at 27 Highland St, Townsend, MA 01469 and is currently estimated at $434,067, approximately $192 per square foot. 27 Highland St is a home located in Middlesex County with nearby schools including North Middlesex Regional High School.
Ownership History
Date
Name
Owned For
Owner Type
Purchase Details
Closed on
Aug 19, 2005
Sold by
Canzanelli Linda C
Bought by
Kelly Lauri A and Webber Stephen T
Current Estimated Value
Home Financials for this Owner
Home Financials are based on the most recent Mortgage that was taken out on this home.
Original Mortgage
$247,900
Outstanding Balance
$130,225
Interest Rate
5.66%
Mortgage Type
Purchase Money Mortgage
Estimated Equity
$303,842
Purchase Details
Closed on
Mar 4, 2003
Sold by
Jack Russell T and Jack Tr
Bought by
Canzanelli Linda C
Home Financials for this Owner
Home Financials are based on the most recent Mortgage that was taken out on this home.
Original Mortgage
$250,705
Interest Rate
5.98%
Mortgage Type
Purchase Money Mortgage
Purchase Details
Closed on
Sep 3, 1998
Sold by
Lorden Gary B
Bought by
Reagan Robyn J
Create a Home Valuation Report for This Property
The Home Valuation Report is an in-depth analysis detailing your home's value as well as a comparison with similar homes in the area
Home Values in the Area
Average Home Value in this Area
Purchase History
| Date | Buyer | Sale Price | Title Company |
|---|---|---|---|
| Kelly Lauri A | $309,900 | -- | |
| Canzanelli Linda C | $260,000 | -- | |
| Reagan Robyn J | $130,000 | -- |
Source: Public Records
Mortgage History
| Date | Status | Borrower | Loan Amount |
|---|---|---|---|
| Open | Kelly Lauri A | $247,900 | |
| Previous Owner | Canzanelli Linda C | $250,705 |
Source: Public Records
Tax History Compared to Growth
Tax History
| Year | Tax Paid | Tax Assessment Tax Assessment Total Assessment is a certain percentage of the fair market value that is determined by local assessors to be the total taxable value of land and additions on the property. | Land | Improvement |
|---|---|---|---|---|
| 2025 | $5,188 | $357,300 | $90,400 | $266,900 |
| 2024 | $5,149 | $357,300 | $90,400 | $266,900 |
| 2023 | $4,934 | $323,300 | $82,200 | $241,100 |
| 2022 | $5,183 | $294,300 | $71,500 | $222,800 |
| 2021 | $5,043 | $275,100 | $70,700 | $204,400 |
| 2020 | $4,851 | $248,500 | $62,900 | $185,600 |
| 2019 | $4,260 | $220,400 | $62,900 | $157,500 |
| 2018 | $4,113 | $203,000 | $62,900 | $140,100 |
| 2017 | $3,875 | $197,000 | $67,000 | $130,000 |
| 2016 | $3,946 | $199,300 | $67,000 | $132,300 |
| 2015 | $3,864 | $202,200 | $69,900 | $132,300 |
| 2014 | $3,863 | $197,400 | $62,900 | $134,500 |
Source: Public Records
Map
Nearby Homes
- 10 Stearns Ave
- 1 Depot Street Extension Unit 2
- 1 Depot Street Extension Unit 5
- 1 Depot Street Extension Unit 3
- 1 Depot Street Extension Unit 4
- 75 Highland St
- 91 Highland St
- 144 Main St
- 64 Meadow Rd
- 20 Bayberry Hill Rd
- 0 Brookline St
- 2 Tamarack Ln
- 31 South St
- 114 Blood Rd
- 30 Bailey Rd
- 364 Townsend Hill Rd
- 18 Beech St
- 86 W Elm Lunenburg Rd Blood Rd
- 5 Chestnut Dr
- 11 Fox Run