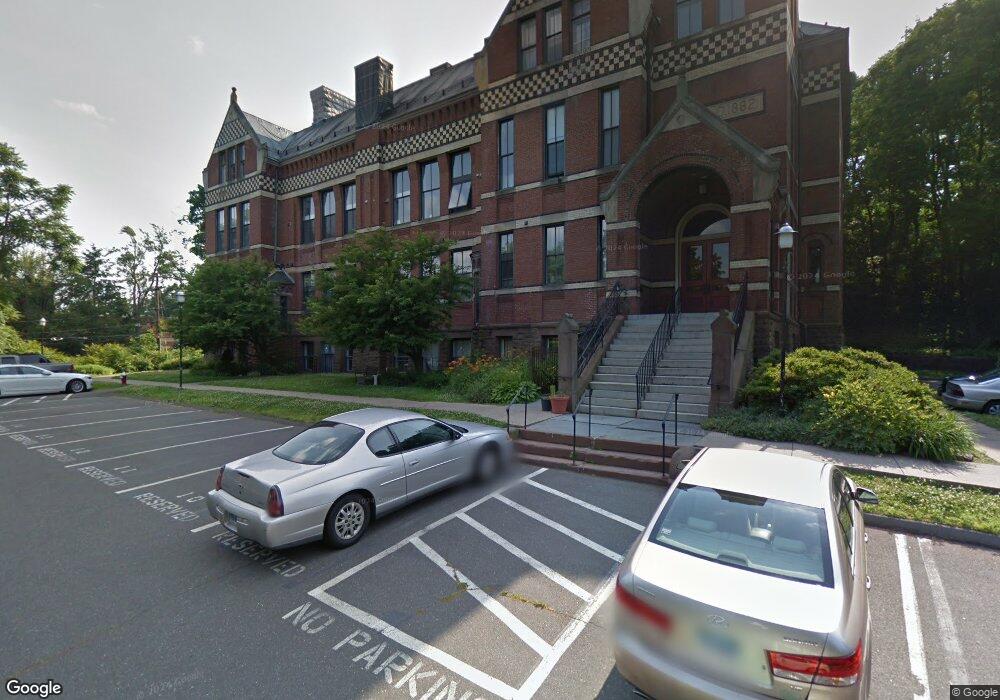
27 Hillside Place Unit 25 New Britain, CT 06051
Estimated Value: $99,000 - $141,000
2
Beds
1
Bath
916
Sq Ft
$132/Sq Ft
Est. Value
About This Home
This home is located at 27 Hillside Place Unit 25, New Britain, CT 06051 and is currently estimated at $120,626, approximately $131 per square foot. 27 Hillside Place Unit 25 is a home located in Hartford County with nearby schools including Vance School, Slade Middle School, and Mountain Laurel Sudbury School.
Ownership History
Date
Name
Owned For
Owner Type
Purchase Details
Closed on
Mar 28, 2019
Sold by
Lim Siew
Bought by
Xu Christopher
Current Estimated Value
Purchase Details
Closed on
Feb 20, 2015
Sold by
Mac Freddie
Bought by
Lim Siew
Purchase Details
Closed on
Jan 7, 2015
Sold by
Wells Fargo Bank Na
Bought by
Fhlmc
Purchase Details
Closed on
Aug 6, 2014
Sold by
Citimortgage Inc
Bought by
Fhlmc
Purchase Details
Closed on
Nov 15, 2006
Sold by
Scott R Lee and Scott Mae
Bought by
Howard Sharedia L
Home Financials for this Owner
Home Financials are based on the most recent Mortgage that was taken out on this home.
Original Mortgage
$103,000
Interest Rate
6.33%
Purchase Details
Closed on
Jul 10, 2002
Sold by
Briardale Ventures Llc
Bought by
Scott R Lee and Scott Nae
Home Financials for this Owner
Home Financials are based on the most recent Mortgage that was taken out on this home.
Original Mortgage
$52,500
Interest Rate
5.5%
Create a Home Valuation Report for This Property
The Home Valuation Report is an in-depth analysis detailing your home's value as well as a comparison with similar homes in the area
Home Values in the Area
Average Home Value in this Area
Purchase History
| Date | Buyer | Sale Price | Title Company |
|---|---|---|---|
| Xu Christopher | $45,000 | -- | |
| Lim Siew | $27,500 | -- | |
| Fhlmc | -- | -- | |
| Wells Fargo Bank Na | -- | -- | |
| Fhlmc | -- | -- | |
| Citimortgage Inc | -- | -- | |
| Howard Sharedia L | $103,000 | -- | |
| Scott R Lee | $74,500 | -- |
Source: Public Records
Mortgage History
| Date | Status | Borrower | Loan Amount |
|---|---|---|---|
| Previous Owner | Scott R Lee | $103,000 | |
| Previous Owner | Scott R Lee | $52,500 |
Source: Public Records
Tax History Compared to Growth
Tax History
| Year | Tax Paid | Tax Assessment Tax Assessment Total Assessment is a certain percentage of the fair market value that is determined by local assessors to be the total taxable value of land and additions on the property. | Land | Improvement |
|---|---|---|---|---|
| 2025 | $2,150 | $54,880 | $0 | $54,880 |
| 2024 | $2,173 | $54,880 | $0 | $54,880 |
| 2023 | $2,101 | $54,880 | $0 | $54,880 |
| 2022 | $2,093 | $42,280 | $0 | $42,280 |
| 2021 | $2,093 | $42,280 | $0 | $42,280 |
| 2020 | $2,135 | $42,280 | $0 | $42,280 |
| 2019 | $2,135 | $42,280 | $0 | $42,280 |
| 2018 | $2,135 | $42,280 | $0 | $42,280 |
| 2017 | $2,531 | $50,120 | $0 | $50,120 |
| 2016 | $2,531 | $50,120 | $0 | $50,120 |
| 2015 | $2,456 | $50,120 | $0 | $50,120 |
| 2014 | $2,456 | $50,120 | $0 | $50,120 |
Source: Public Records
Map
Nearby Homes
- 42 Prospect St
- 60 Prospect St
- 32 W Pearl St
- 14 Park Place Unit 4
- 235 W Main St
- 45 Park Place Unit 205
- 300 W Main St
- 93 Winthrop St
- 239 Glen St Unit 2A
- 385 Columbus Blvd
- 256 Hart St
- 70 Monroe St
- 66 Lincoln St
- 112 Lincoln St
- 18 Union St
- 80 Gold St
- 179 Broad St
- 21 Trinity St Unit 23
- 270 Maple St
- 86 North St
- 27 Hillside Place Unit 30
- 27 Hillside Place Unit 29
- 27 Hillside Place Unit 28
- 27 Hillside Place
- 27 Hillside Place Unit 26
- 27 Hillside Place Unit 24
- 27 Hillside Place Unit 23
- 27 Hillside Place Unit 22
- 27 Hillside Place Unit 21
- 27 Hillside Place Unit 20
- 27 Hillside Place Unit 19
- 27 Hillside Place Unit 18
- 27 Hillside Place Unit 17
- 27 Hillside Place Unit 16
- 27 Hillside Place Unit 15
- 27 Hillside Place Unit 14
- 27 Hillside Place Unit 13
- 27 Hillside Place Unit 12
- 27 Hillside Place Unit 11
- 27 Hillside Place Unit 10