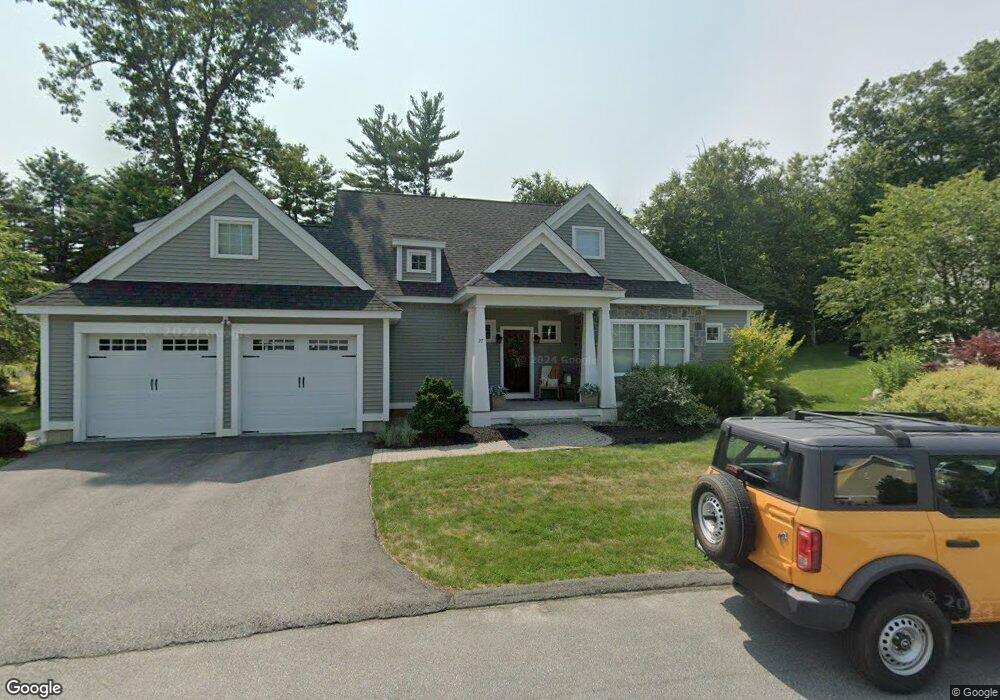
27 Honeycomb Way Newmarket, NH 03857
Estimated Value: $844,000 - $980,624
4
Beds
6
Baths
2,615
Sq Ft
$349/Sq Ft
Est. Value
About This Home
This home is located at 27 Honeycomb Way, Newmarket, NH 03857 and is currently estimated at $913,906, approximately $349 per square foot. 27 Honeycomb Way is a home located in Rockingham County with nearby schools including Newmarket Elementary School, Newmarket Junior High School, and Newmarket Senior High School.
Ownership History
Date
Name
Owned For
Owner Type
Purchase Details
Closed on
Jun 1, 2018
Sold by
Rawley Ft and Rawley
Bought by
Rawley Ft and Rawley
Current Estimated Value
Create a Home Valuation Report for This Property
The Home Valuation Report is an in-depth analysis detailing your home's value as well as a comparison with similar homes in the area
Home Values in the Area
Average Home Value in this Area
Purchase History
| Date | Buyer | Sale Price | Title Company |
|---|---|---|---|
| Rawley Ft | -- | -- |
Source: Public Records
Tax History Compared to Growth
Tax History
| Year | Tax Paid | Tax Assessment Tax Assessment Total Assessment is a certain percentage of the fair market value that is determined by local assessors to be the total taxable value of land and additions on the property. | Land | Improvement |
|---|---|---|---|---|
| 2024 | $15,855 | $921,800 | $273,000 | $648,800 |
| 2023 | $17,019 | $577,100 | $156,000 | $421,100 |
| 2022 | $15,576 | $577,100 | $156,000 | $421,100 |
| 2021 | $15,212 | $577,100 | $156,000 | $421,100 |
| 2020 | $14,359 | $564,000 | $156,000 | $408,000 |
| 2018 | $17,287 | $591,200 | $117,600 | $473,600 |
| 2017 | $15,803 | $591,200 | $117,600 | $473,600 |
| 2016 | $2,993 | $117,600 | $117,600 | $0 |
| 2015 | $2,935 | $117,600 | $117,600 | $0 |
| 2014 | -- | $0 | $0 | $0 |
Source: Public Records
Map
Nearby Homes
- 30 Honeycomb Way
- 325 Lita Ln
- 24 Lilac Ln
- 0 Pear Tree Ln Unit 9
- 0 Pear Tree Ln Unit 10
- 8 Stonewall Way
- 16 Bennett Way
- 29 Hamel Farm Dr
- 141 Hersey Ln
- 85 Princeton St
- 90 Colgate Rd
- 11 Old Lee Rd
- 23 Columbia Dr
- 411 Ash Swamp Rd
- 13 Moonlight Dr
- 3 Swamscott St
- 9 Swamscott St
- 21 Briallia Cir
- 16 Railroad St
- 85 College Rd
- 27 Honeycomb Way Unit Lot 44 Rockingham Gr
- 29 Honeycomb Way
- 25 Honeycomb Way
- 28 Honeycomb Way Unit Lot 30 Rock Green
- 28 Honeycomb Way
- 31 Honeycomb Way
- 26 Honeycomb Way Unit 29
- 26 Honeycomb Way
- 23 Honeycomb Way
- 33 Honeycomb Way
- 33 Honeycomb Way Unit Lot 41
- 24 Honeycomb Way
- 24 Honeycomb Way Unit Lot 28
- 32 Honeycomb Way
- 22 Honeycomb Way
- 22 Honeycomb Way Unit Lot 27
- 50 Honeycomb Way
- 50 Honeycomb Way Unit Lot 40
- 34 Honeycomb Way Unit 33
- 34 Honeycomb Way