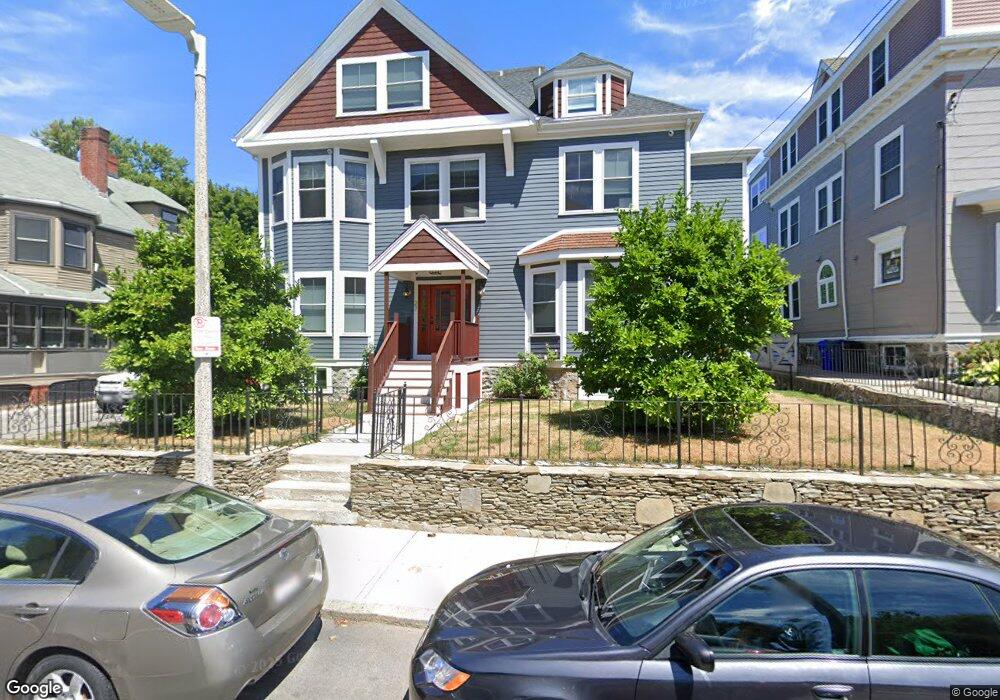
27 Howland St Boston, MA 02121
Washington Park NeighborhoodEstimated Value: $669,000 - $1,497,221
6
Beds
6
Baths
8,200
Sq Ft
$141/Sq Ft
Est. Value
About This Home
This home is located at 27 Howland St, Boston, MA 02121 and is currently estimated at $1,156,055, approximately $140 per square foot. 27 Howland St is a home located in Suffolk County with nearby schools including Bridge Boston Charter School and Mother Caroline Academy & Education Center.
Ownership History
Date
Name
Owned For
Owner Type
Purchase Details
Closed on
Feb 25, 2015
Sold by
Williams Glenroy
Bought by
Karbunara Herion
Current Estimated Value
Home Financials for this Owner
Home Financials are based on the most recent Mortgage that was taken out on this home.
Original Mortgage
$585,000
Outstanding Balance
$443,766
Interest Rate
3.66%
Mortgage Type
Commercial
Estimated Equity
$712,289
Purchase Details
Closed on
Dec 21, 2005
Sold by
Cooper-Paterson C D
Bought by
Grtr Cmnty Bapt Chrch and New Life Resurrection
Purchase Details
Closed on
Aug 10, 1998
Sold by
Cooper Sartreina
Bought by
Grtr Comm Baptist Chrc
Purchase Details
Closed on
Apr 18, 1997
Sold by
Lagesse Rt
Bought by
Cooper-Patterson C
Home Financials for this Owner
Home Financials are based on the most recent Mortgage that was taken out on this home.
Original Mortgage
$127,500
Interest Rate
7.76%
Mortgage Type
Commercial
Purchase Details
Closed on
Jun 5, 1989
Sold by
Granderso Vernard M
Bought by
Lagresse Rt
Create a Home Valuation Report for This Property
The Home Valuation Report is an in-depth analysis detailing your home's value as well as a comparison with similar homes in the area
Home Values in the Area
Average Home Value in this Area
Purchase History
| Date | Buyer | Sale Price | Title Company |
|---|---|---|---|
| Karbunara Herion | $320,750 | -- | |
| Grtr Cmnty Bapt Chrch | -- | -- | |
| Grtr Comm Baptist Chrc | $165,000 | -- | |
| Cooper-Patterson C | $150,000 | -- | |
| Lagresse Rt | $158,200 | -- |
Source: Public Records
Mortgage History
| Date | Status | Borrower | Loan Amount |
|---|---|---|---|
| Open | Karbunara Herion | $585,000 | |
| Previous Owner | Lagresse Rt | $127,500 | |
| Previous Owner | Lagresse Rt | $158,200 | |
| Closed | Lagresse Rt | $0 |
Source: Public Records
Tax History Compared to Growth
Tax History
| Year | Tax Paid | Tax Assessment Tax Assessment Total Assessment is a certain percentage of the fair market value that is determined by local assessors to be the total taxable value of land and additions on the property. | Land | Improvement |
|---|---|---|---|---|
| 2025 | $14,704 | $1,269,800 | $293,600 | $976,200 |
| 2024 | $14,841 | $1,361,600 | $251,400 | $1,110,200 |
| 2023 | $13,671 | $1,272,900 | $235,000 | $1,037,900 |
| 2022 | $13,125 | $1,206,300 | $126,100 | $1,080,200 |
| 2021 | $12,029 | $1,127,400 | $117,800 | $1,009,600 |
| 2020 | $11,290 | $1,069,100 | $117,100 | $952,000 |
| 2019 | $10,337 | $980,698 | $87,025 | $893,673 |
| 2018 | $10,163 | $969,759 | $92,925 | $876,834 |
| 2017 | $11,870 | $1,120,840 | $206,500 | $914,340 |
| 2016 | $14,566 | $543,300 | $147,300 | $396,000 |
| 2015 | -- | $637,000 | $207,300 | $429,700 |
| 2014 | -- | $603,200 | $183,300 | $419,900 |
Source: Public Records
Map
Nearby Homes
- 7 Waumbeck St Unit 3
- 495 Warren St
- 4 Wyoming St Unit 2
- 28 Wabon St
- 476 Warren St
- 164 Ruthven St Unit 1
- 5 Glenburne St
- 2 Otisfield St
- 8 Weldon St
- 12 Weldon St
- 352 Blue Hill Ave Unit 8
- 340 Blue Hill Ave
- 40 Devon St Unit 3
- 214 Humboldt Ave
- 99 Harrishof St
- 52 Intervale St
- 32 Hartwell St
- 151 Townsend St
- 63 Normandy St
- 75 Ruthven St
- 27 Howland St Unit 1
- 27 Howland St Unit 2
- 27 Howland St Unit B
- 29 Howland St
- 27 Elm Hill Ave
- 32 Wenonah St
- 30 Wenonah St
- 30 Wenonah St Unit 1
- 30 Wenonah St Unit 3
- 30 Wenonah St Unit 2
- 34 Wenonah St
- 31 Howland St
- 36 Wenonah St
- 21 Elm Hill Ave
- 30 Howland St
- 30 Howaland Unit 2
- 30 Howland St Unit 3
- 30 Howland St Unit 2
- 33 Howland St
- 34 Elm Hill Ave