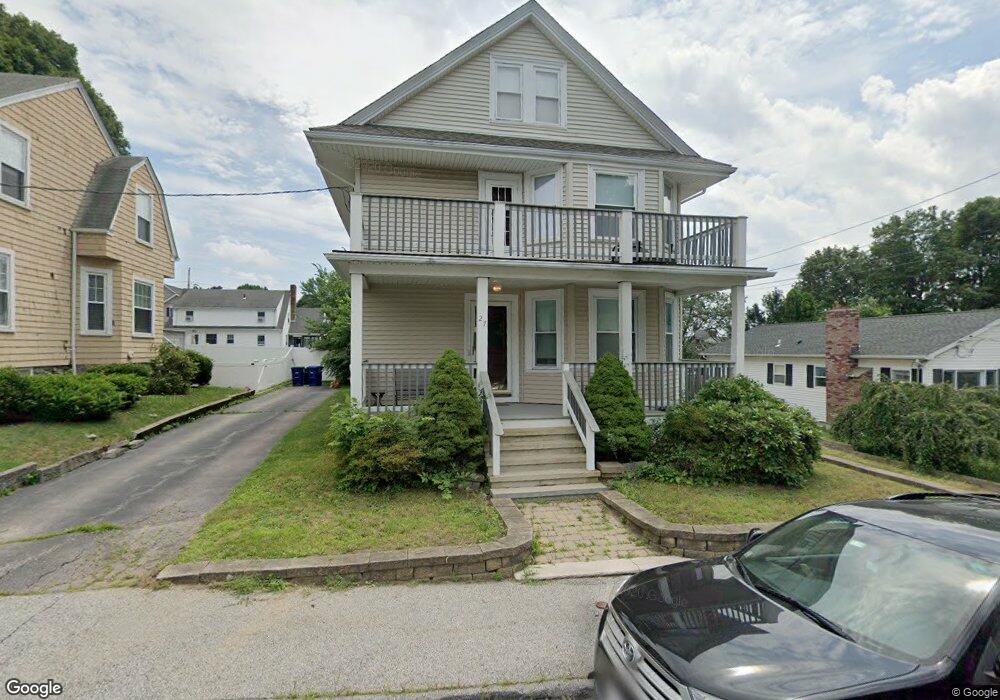
27 Hunt Ave Braintree, MA 02184
East Braintree NeighborhoodEstimated Value: $667,000 - $810,000
3
Beds
2
Baths
999
Sq Ft
$759/Sq Ft
Est. Value
About This Home
This home is located at 27 Hunt Ave, Braintree, MA 02184 and is currently estimated at $758,608, approximately $759 per square foot. 27 Hunt Ave is a home located in Norfolk County with nearby schools including Braintree High School, Meeting House Montessori School, and South Shore SDA School.
Ownership History
Date
Name
Owned For
Owner Type
Purchase Details
Closed on
Feb 14, 1996
Sold by
Anderson Rt
Bought by
Andrews George R
Current Estimated Value
Home Financials for this Owner
Home Financials are based on the most recent Mortgage that was taken out on this home.
Original Mortgage
$116,250
Outstanding Balance
$3,797
Interest Rate
6.99%
Mortgage Type
Purchase Money Mortgage
Estimated Equity
$754,811
Create a Home Valuation Report for This Property
The Home Valuation Report is an in-depth analysis detailing your home's value as well as a comparison with similar homes in the area
Home Values in the Area
Average Home Value in this Area
Purchase History
| Date | Buyer | Sale Price | Title Company |
|---|---|---|---|
| Andrews George R | $155,000 | -- |
Source: Public Records
Mortgage History
| Date | Status | Borrower | Loan Amount |
|---|---|---|---|
| Open | Andrews George R | $116,250 | |
| Previous Owner | Andrews George R | $100,000 | |
| Closed | Andrews George R | $30,000 |
Source: Public Records
Tax History Compared to Growth
Tax History
| Year | Tax Paid | Tax Assessment Tax Assessment Total Assessment is a certain percentage of the fair market value that is determined by local assessors to be the total taxable value of land and additions on the property. | Land | Improvement |
|---|---|---|---|---|
| 2025 | $7,028 | $704,200 | $313,400 | $390,800 |
| 2024 | $6,098 | $643,200 | $292,200 | $351,000 |
| 2023 | $5,747 | $588,800 | $262,600 | $326,200 |
| 2022 | $5,606 | $563,400 | $237,200 | $326,200 |
| 2021 | $5,049 | $507,400 | $214,300 | $293,100 |
| 2020 | $4,778 | $484,600 | $194,800 | $289,800 |
| 2019 | $4,600 | $455,900 | $186,300 | $269,600 |
| 2018 | $4,505 | $427,400 | $169,400 | $258,000 |
| 2017 | $4,499 | $418,900 | $160,900 | $258,000 |
| 2016 | $3,867 | $352,200 | $135,500 | $216,700 |
| 2015 | $3,880 | $350,500 | $133,800 | $216,700 |
| 2014 | $3,566 | $312,300 | $122,000 | $190,300 |
Source: Public Records
Map
Nearby Homes
- 205 River St
- 8 Vinton Ave Unit 10
- 150 Elm St Unit 1
- 39 Morrison Rd
- 10 Cochato Rd
- 94 Kensington St
- 391 Commercial St
- 23 Bower Rd
- 71 Robbie Rd
- 161 Cedar St
- 11 Rogers Cir
- 106 Home Park Rd
- 230 Lisle St
- 53 Parkside Ave
- 102 Conrad St
- 131 Monatiquot Ave
- 175 West St
- 39 Dobson Rd
- 25 John Paul Cir
- 64 Alfred Rd