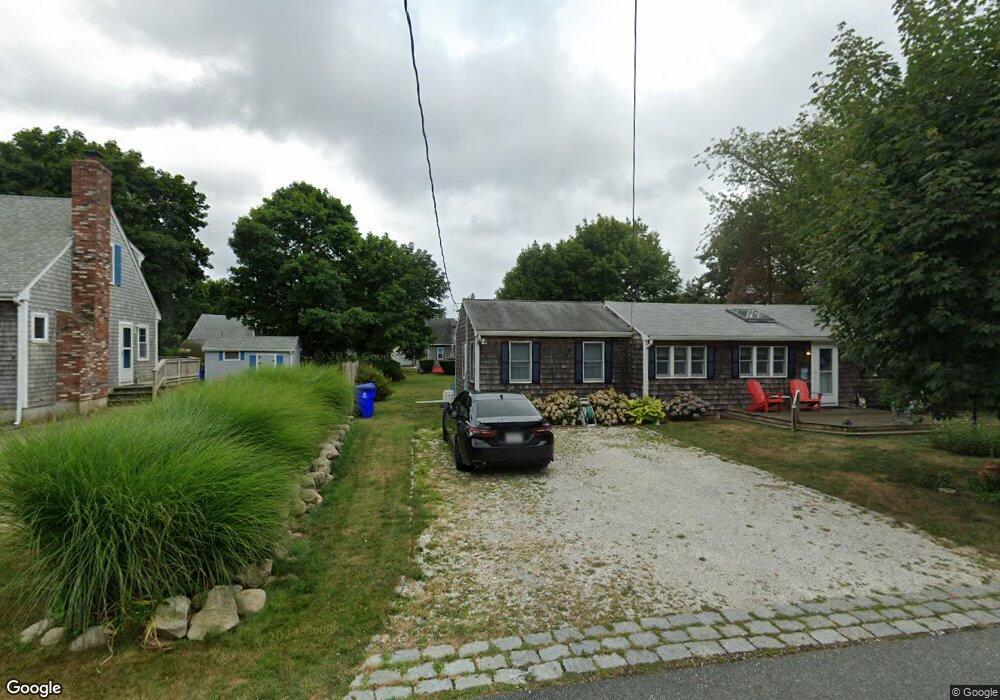
27 Kendrick Ln Pocasset, MA 02559
Pocasset NeighborhoodEstimated Value: $510,000 - $696,000
3
Beds
1
Bath
1,216
Sq Ft
$512/Sq Ft
Est. Value
About This Home
This home is located at 27 Kendrick Ln, Pocasset, MA 02559 and is currently estimated at $623,177, approximately $512 per square foot. 27 Kendrick Ln is a home located in Barnstable County with nearby schools including Bourne High School and Cadence Academy Preschool - Bourne.
Ownership History
Date
Name
Owned For
Owner Type
Purchase Details
Closed on
May 9, 2013
Sold by
Luna Catherine M and Luna Stephen J
Bought by
Sjlcml T T and Sjlcml Luna
Current Estimated Value
Purchase Details
Closed on
May 15, 1992
Sold by
Holcombe Richard H and Holcombe Carol R
Bought by
Luna Stephen J and Luna Catherine M
Home Financials for this Owner
Home Financials are based on the most recent Mortgage that was taken out on this home.
Original Mortgage
$60,000
Interest Rate
8.89%
Mortgage Type
Purchase Money Mortgage
Purchase Details
Closed on
Mar 13, 1990
Sold by
First Exahange Corp
Bought by
Holcombe Richard H
Create a Home Valuation Report for This Property
The Home Valuation Report is an in-depth analysis detailing your home's value as well as a comparison with similar homes in the area
Home Values in the Area
Average Home Value in this Area
Purchase History
| Date | Buyer | Sale Price | Title Company |
|---|---|---|---|
| Sjlcml T T | -- | -- | |
| Sjlcml T T | -- | -- | |
| Luna Stephen J | $82,500 | -- | |
| Luna Stephen J | $82,500 | -- | |
| Holcombe Richard H | $116,000 | -- | |
| Holcombe Richard H | $116,000 | -- |
Source: Public Records
Mortgage History
| Date | Status | Borrower | Loan Amount |
|---|---|---|---|
| Previous Owner | Holcombe Richard H | $60,000 |
Source: Public Records
Tax History Compared to Growth
Tax History
| Year | Tax Paid | Tax Assessment Tax Assessment Total Assessment is a certain percentage of the fair market value that is determined by local assessors to be the total taxable value of land and additions on the property. | Land | Improvement |
|---|---|---|---|---|
| 2025 | $3,864 | $494,700 | $278,900 | $215,800 |
| 2024 | $3,704 | $461,900 | $265,600 | $196,300 |
| 2023 | $3,603 | $409,000 | $235,000 | $174,000 |
| 2022 | $3,299 | $327,000 | $188,500 | $138,500 |
| 2021 | $3,207 | $297,800 | $171,600 | $126,200 |
| 2020 | $3,117 | $290,200 | $169,900 | $120,300 |
| 2019 | $2,981 | $283,600 | $169,900 | $113,700 |
| 2018 | $2,792 | $264,900 | $161,900 | $103,000 |
| 2017 | $2,701 | $262,200 | $160,300 | $101,900 |
| 2016 | $2,490 | $245,100 | $160,300 | $84,800 |
| 2015 | $2,468 | $245,100 | $160,300 | $84,800 |
Source: Public Records
Map
Nearby Homes