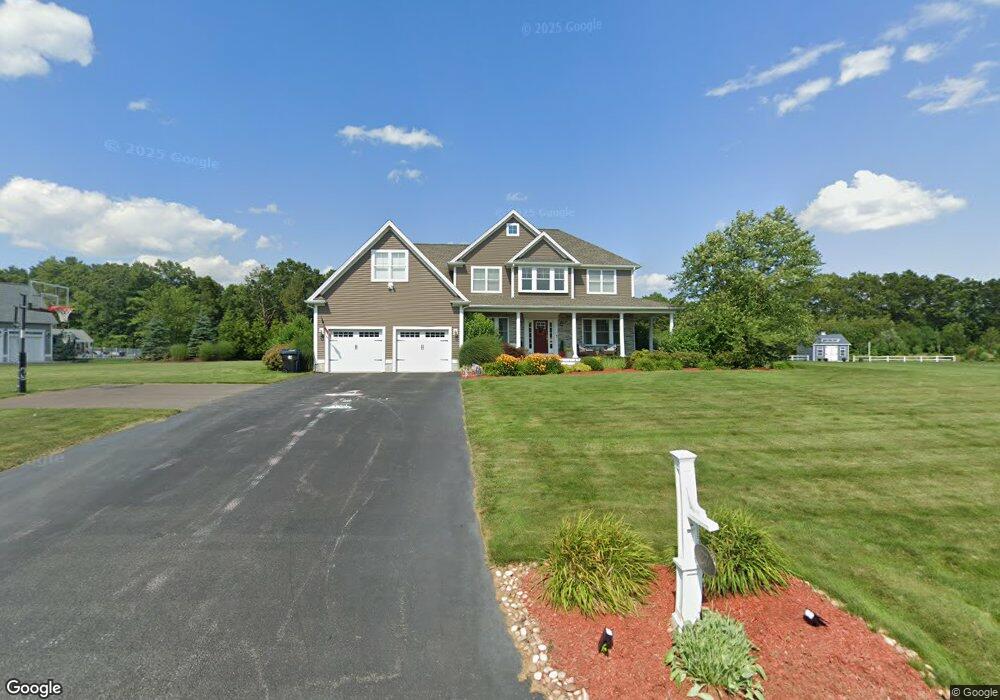
27 Linden Ln Rehoboth, MA 02769
Estimated Value: $906,010 - $1,392,000
4
Beds
4
Baths
3,078
Sq Ft
$362/Sq Ft
Est. Value
About This Home
This home is located at 27 Linden Ln, Rehoboth, MA 02769 and is currently estimated at $1,112,753, approximately $361 per square foot. 27 Linden Ln is a home located in Bristol County with nearby schools including Dighton-Rehoboth Regional High School and Cedar Brook School.
Ownership History
Date
Name
Owned For
Owner Type
Purchase Details
Closed on
Nov 3, 2014
Sold by
Ferreira John P
Bought by
Levinson Jeanine M and Levinson Michael E
Current Estimated Value
Home Financials for this Owner
Home Financials are based on the most recent Mortgage that was taken out on this home.
Original Mortgage
$546,000
Outstanding Balance
$419,077
Interest Rate
4.21%
Mortgage Type
Purchase Money Mortgage
Estimated Equity
$693,676
Create a Home Valuation Report for This Property
The Home Valuation Report is an in-depth analysis detailing your home's value as well as a comparison with similar homes in the area
Home Values in the Area
Average Home Value in this Area
Purchase History
| Date | Buyer | Sale Price | Title Company |
|---|---|---|---|
| Levinson Jeanine M | $185,000 | -- |
Source: Public Records
Mortgage History
| Date | Status | Borrower | Loan Amount |
|---|---|---|---|
| Open | Levinson Jeanine M | $546,000 |
Source: Public Records
Tax History
| Year | Tax Paid | Tax Assessment Tax Assessment Total Assessment is a certain percentage of the fair market value that is determined by local assessors to be the total taxable value of land and additions on the property. | Land | Improvement |
|---|---|---|---|---|
| 2025 | $93 | $837,900 | $203,500 | $634,400 |
| 2024 | $9,524 | $838,400 | $212,200 | $626,200 |
| 2023 | $8,826 | $762,200 | $207,800 | $554,400 |
| 2022 | $8,699 | $686,600 | $190,900 | $495,700 |
| 2021 | $8,226 | $621,300 | $174,300 | $447,000 |
| 2020 | $8,193 | $624,500 | $177,500 | $447,000 |
| 2018 | $2,872 | $562,600 | $156,900 | $405,700 |
| 2017 | $6,480 | $515,900 | $163,800 | $352,100 |
| 2016 | $2,074 | $170,700 | $170,700 | $0 |
| 2015 | $2,005 | $162,900 | $162,900 | $0 |
Source: Public Records
Map
Nearby Homes
Your Personal Tour Guide
Ask me questions while you tour the home.