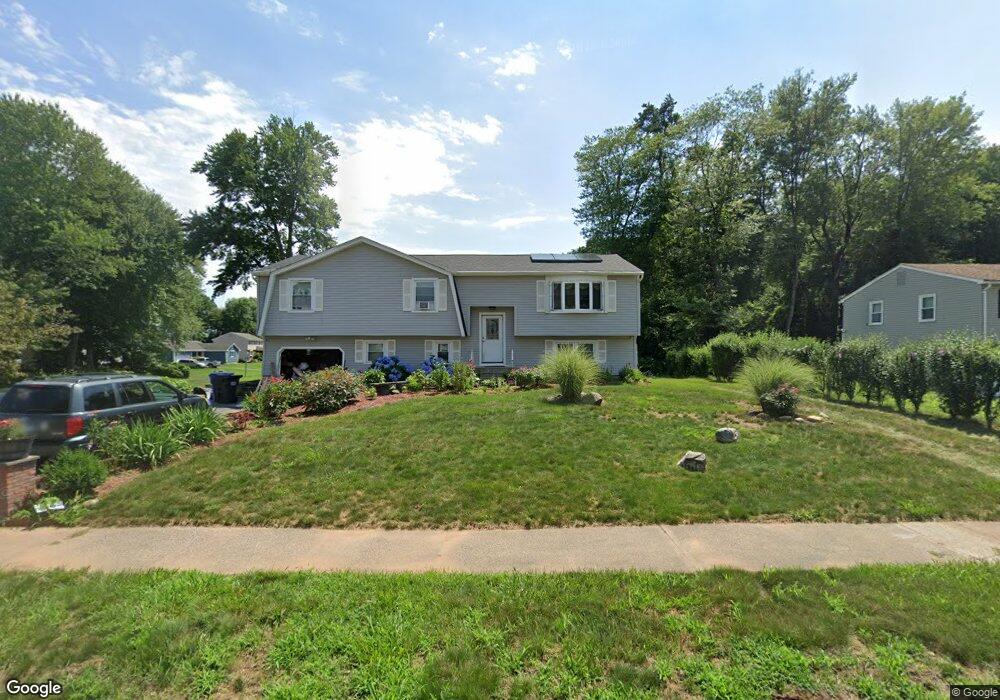
27 Linwood Dr Bloomfield, CT 06002
Estimated Value: $322,000 - $407,000
3
Beds
3
Baths
1,444
Sq Ft
$258/Sq Ft
Est. Value
About This Home
This home is located at 27 Linwood Dr, Bloomfield, CT 06002 and is currently estimated at $373,101, approximately $258 per square foot. 27 Linwood Dr is a home located in Hartford County with nearby schools including Laurel School, Carmen Arace Intermediate School, and Metacomet School.
Ownership History
Date
Name
Owned For
Owner Type
Purchase Details
Closed on
May 26, 2016
Sold by
Stuart Stephen O and Stuart Olive
Bought by
Weir Olive
Current Estimated Value
Purchase Details
Closed on
Nov 15, 2005
Sold by
Usa Va
Bought by
Stuart Stephen
Purchase Details
Closed on
May 6, 1997
Sold by
Capital Venture Group
Bought by
Ritter Roger and Ritter Monnece
Create a Home Valuation Report for This Property
The Home Valuation Report is an in-depth analysis detailing your home's value as well as a comparison with similar homes in the area
Home Values in the Area
Average Home Value in this Area
Purchase History
| Date | Buyer | Sale Price | Title Company |
|---|---|---|---|
| Weir Olive | -- | -- | |
| Weir Olive | -- | -- | |
| Stuart Stephen | $198,000 | -- | |
| Stuart Stephen | $198,000 | -- | |
| Ritter Roger | $129,900 | -- | |
| Ritter Roger | $129,900 | -- |
Source: Public Records
Mortgage History
| Date | Status | Borrower | Loan Amount |
|---|---|---|---|
| Previous Owner | Ritter Roger | $243,183 | |
| Previous Owner | Ritter Roger | $243,183 |
Source: Public Records
Tax History Compared to Growth
Tax History
| Year | Tax Paid | Tax Assessment Tax Assessment Total Assessment is a certain percentage of the fair market value that is determined by local assessors to be the total taxable value of land and additions on the property. | Land | Improvement |
|---|---|---|---|---|
| 2025 | $8,568 | $228,480 | $52,080 | $176,400 |
| 2024 | $5,499 | $140,140 | $39,270 | $100,870 |
| 2023 | $5,400 | $140,140 | $39,270 | $100,870 |
| 2022 | $5,049 | $140,140 | $39,270 | $100,870 |
| 2021 | $5,161 | $140,140 | $39,270 | $100,870 |
| 2020 | $5,081 | $140,140 | $39,270 | $100,870 |
| 2019 | $5,329 | $137,830 | $39,270 | $98,560 |
| 2018 | $4,347 | $112,560 | $38,500 | $74,060 |
| 2017 | $4,340 | $112,560 | $38,500 | $74,060 |
| 2016 | $4,238 | $112,560 | $38,500 | $74,060 |
Source: Public Records
Map
Nearby Homes
- 234 Woodland Ave
- 208 Castlewood Dr Unit 208
- 108 Woodland Ave
- 23 Hawthorne Ln Unit 23
- 28 Carpenter Ln
- 30 Vista Way
- 10 Foothills Way
- 25 Filley St
- 394 Tunxis Ave
- 14 Filley St
- 12 Filley St
- 18 Nolan Dr
- 5 Butternut Dr
- 2 Lee Cir
- 10 Butternut Dr
- 8 Roberts Rd
- 6 Wild Rose Ct Unit 6
- 4 Skinner Dr
- 67 Adams Rd
- 40 Mountain Ave