27 Lisa Ln Georgetown, MA 01833
Estimated Value: $1,034,000 - $1,132,472
4
Beds
3
Baths
2,672
Sq Ft
$402/Sq Ft
Est. Value
About This Home
This home is located at 27 Lisa Ln, Georgetown, MA 01833 and is currently estimated at $1,075,368, approximately $402 per square foot. 27 Lisa Ln is a home with nearby schools including Perley Elementary School, Penn Brook School, and Georgetown High School.
Ownership History
Date
Name
Owned For
Owner Type
Purchase Details
Closed on
Sep 6, 2016
Sold by
Georgetow Turning Leaf
Bought by
Davenport James D and Davenport Hope M
Current Estimated Value
Purchase Details
Closed on
Aug 7, 2015
Sold by
Georgetow Turning Leaf
Bought by
Davenport James D and Davenport Hope M
Home Financials for this Owner
Home Financials are based on the most recent Mortgage that was taken out on this home.
Original Mortgage
$417,000
Interest Rate
4.03%
Mortgage Type
New Conventional
Create a Home Valuation Report for This Property
The Home Valuation Report is an in-depth analysis detailing your home's value as well as a comparison with similar homes in the area
Home Values in the Area
Average Home Value in this Area
Purchase History
| Date | Buyer | Sale Price | Title Company |
|---|---|---|---|
| Davenport James D | -- | -- | |
| Davenport James D | $265,000 | -- |
Source: Public Records
Mortgage History
| Date | Status | Borrower | Loan Amount |
|---|---|---|---|
| Previous Owner | Davenport James D | $417,000 |
Source: Public Records
Tax History
| Year | Tax Paid | Tax Assessment Tax Assessment Total Assessment is a certain percentage of the fair market value that is determined by local assessors to be the total taxable value of land and additions on the property. | Land | Improvement |
|---|---|---|---|---|
| 2025 | $13,126 | $1,186,800 | $461,500 | $725,300 |
| 2024 | $12,771 | $1,017,600 | $318,300 | $699,300 |
| 2023 | $13,208 | $1,017,600 | $318,300 | $699,300 |
| 2022 | $12,502 | $887,900 | $276,700 | $611,200 |
| 2021 | $12,234 | $769,900 | $276,700 | $493,200 |
| 2020 | $11,343 | $712,500 | $276,700 | $435,800 |
| 2019 | $11,161 | $707,300 | $271,500 | $435,800 |
| 2018 | $11,232 | $707,300 | $271,500 | $435,800 |
| 2017 | $7,505 | $463,000 | $271,400 | $191,600 |
| 2016 | $1,893 | $119,300 | $119,300 | $0 |
Source: Public Records
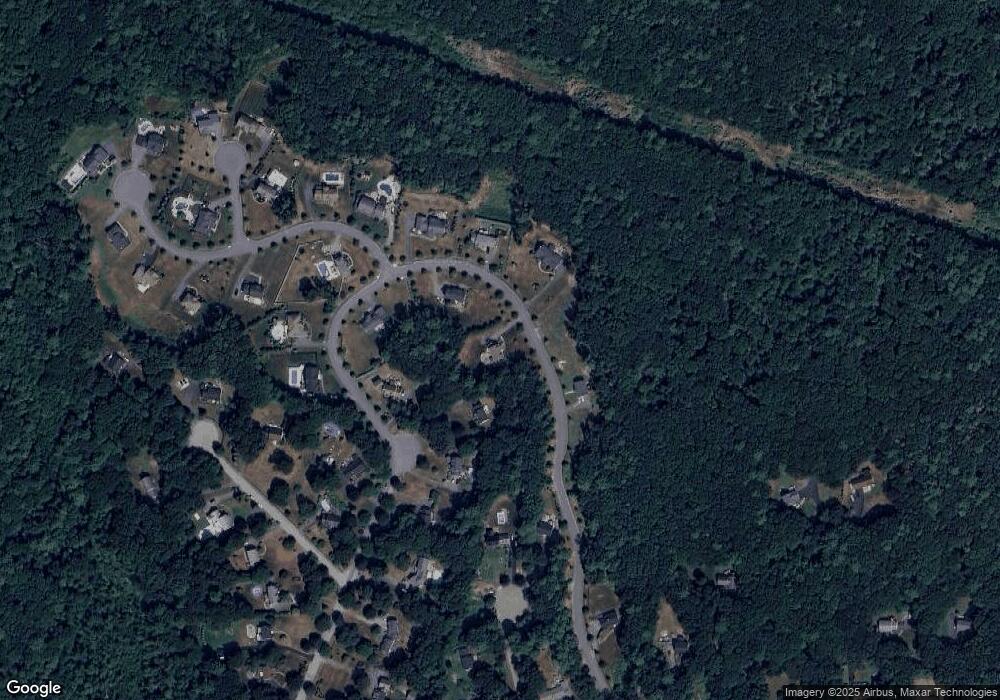
Map
Nearby Homes
- 22 Tenney St
- 8 Molloy Rd
- 32 Summer St
- 11 Central St
- 64 W Main St
- 459 North St
- 12 Warren St
- 52 Andover St
- 30 Christa Dr
- 66 Parish Rd Unit 8
- 11 Main St
- 870 Haverhill St Unit 2B
- 13 Main St
- 206 W Main St Unit 5
- 206 W Main St Unit 4
- 206 W Main St Unit 2
- 206 W Main St Unit 3
- 231 W Main St
- 11 Davis Ln
- 107 King George Dr Unit 9
Your Personal Tour Guide
Ask me questions while you tour the home.