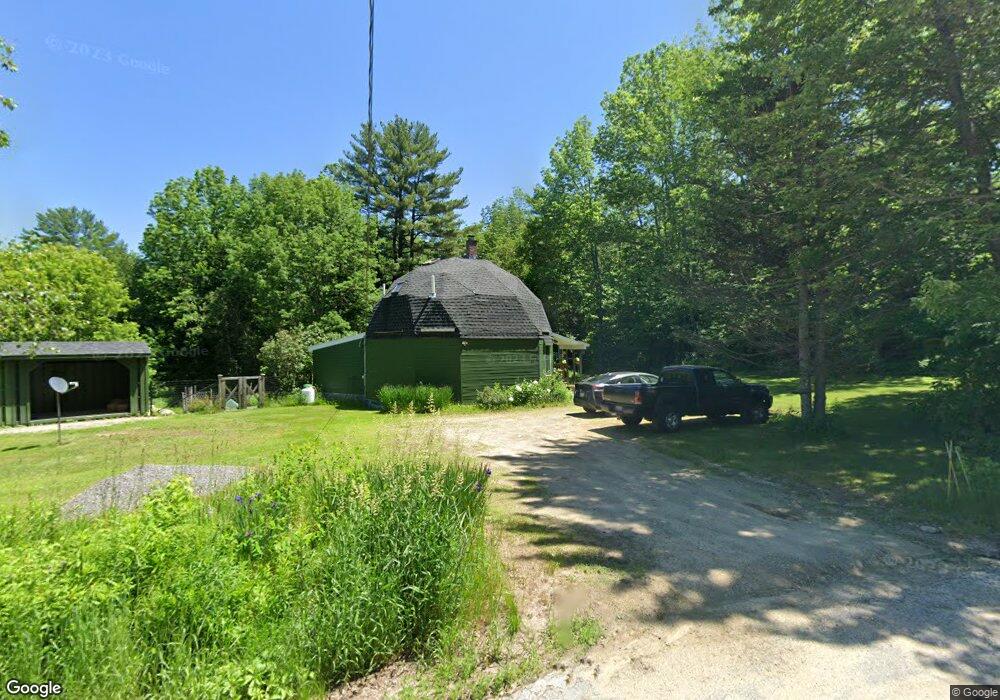
27 Lower Sumner Hill Rd Sumner, ME 04292
Estimated Value: $94,000 - $311,000
Studio
--
Bath
615
Sq Ft
$368/Sq Ft
Est. Value
About This Home
This home is located at 27 Lower Sumner Hill Rd, Sumner, ME 04292 and is currently estimated at $226,077, approximately $367 per square foot. 27 Lower Sumner Hill Rd is a home located in Oxford County with nearby schools including Hartford-Sumner Elementary School, Buckfield Junior/Senior High School, and West Sumner Christian School.
Create a Home Valuation Report for This Property
The Home Valuation Report is an in-depth analysis detailing your home's value as well as a comparison with similar homes in the area
Tax History
| Year | Tax Paid | Tax Assessment Tax Assessment Total Assessment is a certain percentage of the fair market value that is determined by local assessors to be the total taxable value of land and additions on the property. | Land | Improvement |
|---|---|---|---|---|
| 2025 | $3,766 | $241,433 | $58,095 | $183,338 |
| 2024 | $3,139 | $241,433 | $58,095 | $183,338 |
| 2023 | $2,492 | $118,114 | $38,650 | $79,464 |
| 2022 | $2,439 | $118,114 | $38,650 | $79,464 |
| 2021 | $2,287 | $110,773 | $38,650 | $72,123 |
| 2020 | $2,287 | $110,773 | $38,650 | $72,123 |
| 2019 | $2,217 | $108,958 | $38,650 | $70,308 |
| 2018 | $2,103 | $108,958 | $38,650 | $70,308 |
| 2017 | $1,946 | $106,365 | $38,650 | $67,715 |
| 2016 | $1,803 | $106,365 | $38,650 | $67,715 |
| 2015 | $1,744 | $106,365 | $38,650 | $67,715 |
| 2014 | $1,702 | $106,365 | $38,650 | $67,715 |
| 2013 | $1,670 | $106,365 | $38,650 | $67,715 |
Source: Public Records
Map
Nearby Homes
- 585 Main St
- 729 Main St
- 67 Fields Hill Rd
- 42 Front St
- 20 Front St
- 15 Front St
- 66 Ridge Rd
- 409 Gammon Rd
- M19 L6-6 Tuell Hill Rd
- 1443 Main St
- 14 Butterfield Rd
- Lots 10&11 Davenport Rd
- 289 Tucker Rd
- 14 Mcneil Rd
- 71 Mountain View Dr
- 20 Kittridge Brook Rd
- 240 Darrington Rd
- Lot#32 Beech Ridge Ln
- 418 E Shore Rd
- Lot A Blackberry Ln
- 21 Lower Sumner Hill Rd
- 24 Lower Sumner Hill Rd
- 25 Lower Sumner Hill Rd
- 0 Sumner Hill Rd Unit 1068042
- 29 Lower Sumner Hill Rd
- 10 Upper Sumner Hill Rd
- 643 Main St
- 23 Lower Sumner Hill Rd
- 707 Main St
- 719 Main St
- 47 Upper Sumner Hill Rd
- 640 Main St
- 88 Lower Sumner Hill Rd
- 738 Main St
- 0 Lower Sumner Hill Rd
- 57 Upper Sumner Hill Rd
- 740 Main St
- 753 Main St
- 615 Main St
- 104 Lower Sumner Hill Rd
Your Personal Tour Guide
Ask me questions while you tour the home.