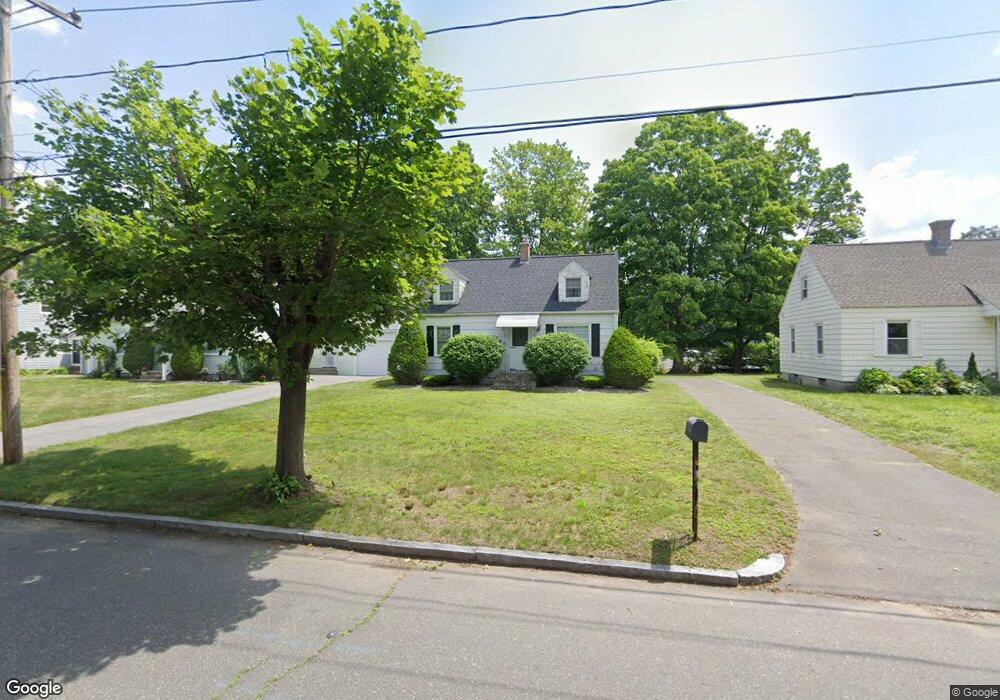
27 Lumae St Springfield, MA 01119
Sixteen Acres NeighborhoodEstimated Value: $273,777 - $291,000
3
Beds
2
Baths
922
Sq Ft
$307/Sq Ft
Est. Value
About This Home
This home is located at 27 Lumae St, Springfield, MA 01119 and is currently estimated at $283,444, approximately $307 per square foot. 27 Lumae St is a home located in Hampden County with nearby schools including Glickman Elementary, John J Duggan Middle, and Springfield High School of Science and Technology.
Ownership History
Date
Name
Owned For
Owner Type
Purchase Details
Closed on
Aug 19, 2002
Sold by
Est Mayhew Roland R and Mayhew Brenda A
Bought by
Mayhew Stephen S
Current Estimated Value
Home Financials for this Owner
Home Financials are based on the most recent Mortgage that was taken out on this home.
Original Mortgage
$79,748
Outstanding Balance
$33,890
Interest Rate
6.61%
Mortgage Type
Purchase Money Mortgage
Estimated Equity
$249,554
Create a Home Valuation Report for This Property
The Home Valuation Report is an in-depth analysis detailing your home's value as well as a comparison with similar homes in the area
Home Values in the Area
Average Home Value in this Area
Purchase History
| Date | Buyer | Sale Price | Title Company |
|---|---|---|---|
| Mayhew Stephen S | $81,000 | -- |
Source: Public Records
Mortgage History
| Date | Status | Borrower | Loan Amount |
|---|---|---|---|
| Open | Mayhew Stephen S | $79,748 |
Source: Public Records
Tax History
| Year | Tax Paid | Tax Assessment Tax Assessment Total Assessment is a certain percentage of the fair market value that is determined by local assessors to be the total taxable value of land and additions on the property. | Land | Improvement |
|---|---|---|---|---|
| 2025 | $3,277 | $209,000 | $51,400 | $157,600 |
| 2024 | $3,376 | $210,200 | $51,400 | $158,800 |
| 2023 | $3,001 | $176,000 | $49,000 | $127,000 |
| 2022 | $2,686 | $142,700 | $49,000 | $93,700 |
| 2021 | $2,578 | $136,400 | $44,500 | $91,900 |
| 2020 | $2,658 | $136,100 | $44,500 | $91,600 |
| 2019 | $2,710 | $137,700 | $44,500 | $93,200 |
| 2018 | $2,698 | $137,100 | $44,500 | $92,600 |
| 2017 | $2,684 | $136,500 | $44,000 | $92,500 |
| 2016 | $2,613 | $132,900 | $44,000 | $88,900 |
| 2015 | $2,471 | $125,600 | $44,000 | $81,600 |
Source: Public Records
Map
Nearby Homes
- Lot 37 Kane St
- 39 Groton St
- 186 Bolton St
- 235 Starling Rd
- 121 Mallowhill Rd
- 88 Senator St
- 244 Nassau Dr Unit 244
- 25 Nassau Dr Unit 25
- 72 Nassau Dr
- 173 Nassau Dr
- 38 Northway Dr
- 367 Nassau Dr Unit 367
- 854 Grayson Dr
- 74 Valley Rd
- 31 Acrebrook Rd
- 56 Rosemary Dr
- 130 Spear Rd
- 119 Acrebrook Rd
- 19 Annies Way
- 17 Jeanne Marie St
Your Personal Tour Guide
Ask me questions while you tour the home.