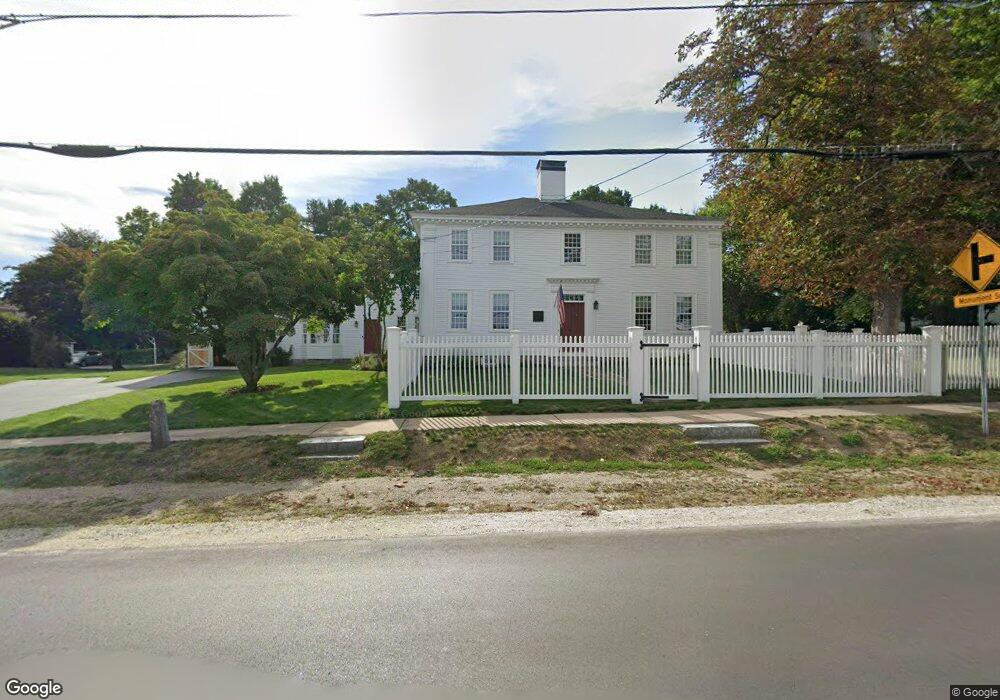
27 Main St Hollis, NH 03049
Hollis NeighborhoodEstimated Value: $778,000 - $1,291,000
6
Beds
3
Baths
4,224
Sq Ft
$255/Sq Ft
Est. Value
About This Home
This home is located at 27 Main St, Hollis, NH 03049 and is currently estimated at $1,078,284, approximately $255 per square foot. 27 Main St is a home with nearby schools including Hollis Primary School, Hollis Upper Elementary School, and Hollis-Brookline Middle School.
Ownership History
Date
Name
Owned For
Owner Type
Purchase Details
Closed on
Sep 17, 1997
Sold by
198 Phyllis M Coniaris
Bought by
Brown Daniel E and Brown Lynn A
Current Estimated Value
Home Financials for this Owner
Home Financials are based on the most recent Mortgage that was taken out on this home.
Original Mortgage
$272,000
Outstanding Balance
$41,819
Interest Rate
7.38%
Estimated Equity
$1,036,465
Create a Home Valuation Report for This Property
The Home Valuation Report is an in-depth analysis detailing your home's value as well as a comparison with similar homes in the area
Home Values in the Area
Average Home Value in this Area
Purchase History
| Date | Buyer | Sale Price | Title Company |
|---|---|---|---|
| Brown Daniel E | $340,000 | -- |
Source: Public Records
Mortgage History
| Date | Status | Borrower | Loan Amount |
|---|---|---|---|
| Open | Brown Daniel E | $50,000 | |
| Open | Brown Daniel E | $272,000 |
Source: Public Records
Tax History Compared to Growth
Tax History
| Year | Tax Paid | Tax Assessment Tax Assessment Total Assessment is a certain percentage of the fair market value that is determined by local assessors to be the total taxable value of land and additions on the property. | Land | Improvement |
|---|---|---|---|---|
| 2024 | $16,586 | $935,500 | $243,500 | $692,000 |
| 2023 | $13,596 | $816,100 | $243,500 | $572,600 |
| 2022 | $6,867 | $816,100 | $243,500 | $572,600 |
| 2021 | $13,908 | $612,700 | $156,300 | $456,400 |
| 2020 | $5,101 | $612,700 | $156,300 | $456,400 |
| 2019 | $0 | $612,700 | $156,300 | $456,400 |
| 2018 | $13,277 | $612,700 | $156,300 | $456,400 |
| 2017 | $12,904 | $557,400 | $136,300 | $421,100 |
| 2016 | $13,060 | $557,400 | $136,300 | $421,100 |
| 2015 | $12,831 | $557,400 | $136,300 | $421,100 |
| 2014 | $12,893 | $557,400 | $136,300 | $421,100 |
| 2013 | $12,720 | $557,400 | $136,300 | $421,100 |
Source: Public Records
Map
Nearby Homes