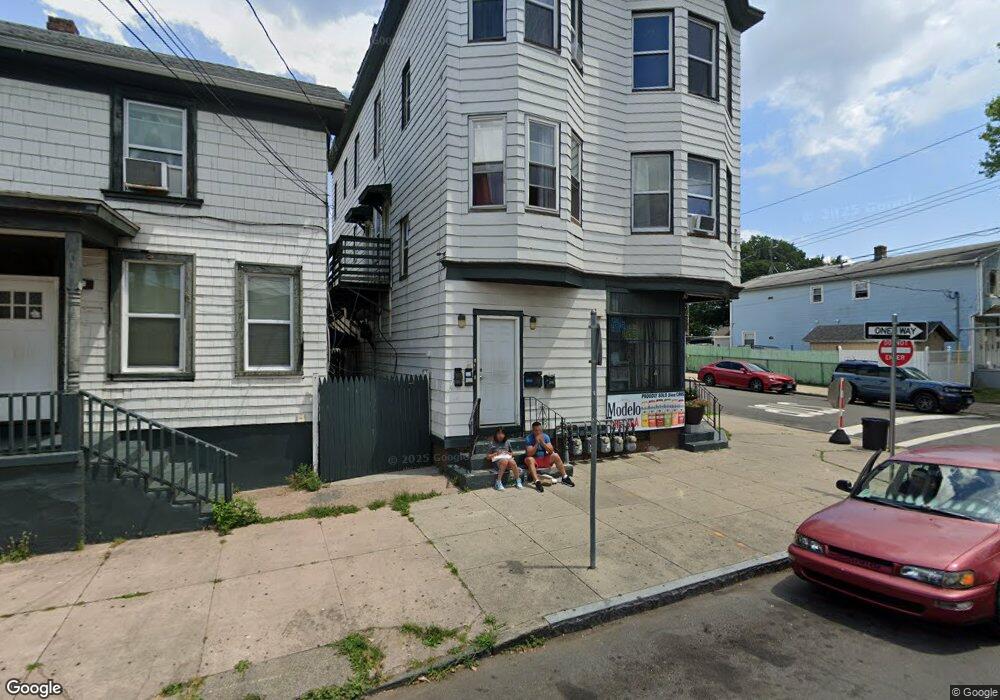
27 Main St New Haven, CT 06513
Fair Haven NeighborhoodEstimated Value: $530,386
--
Bed
--
Bath
3,789
Sq Ft
$140/Sq Ft
Est. Value
About This Home
This home is located at 27 Main St, New Haven, CT 06513 and is currently estimated at $530,386, approximately $139 per square foot. 27 Main St is a home located in New Haven County with nearby schools including Clinton Avenue School, Elm City College Preparatory School, and St Francis & St Rose Of Lima School.
Ownership History
Date
Name
Owned For
Owner Type
Purchase Details
Closed on
Feb 1, 2001
Sold by
Pendragon Re Corp
Bought by
Neary 1 Llc
Current Estimated Value
Home Financials for this Owner
Home Financials are based on the most recent Mortgage that was taken out on this home.
Original Mortgage
$156,000
Interest Rate
18%
Mortgage Type
Commercial
Create a Home Valuation Report for This Property
The Home Valuation Report is an in-depth analysis detailing your home's value as well as a comparison with similar homes in the area
Home Values in the Area
Average Home Value in this Area
Purchase History
| Date | Buyer | Sale Price | Title Company |
|---|---|---|---|
| Neary 1 Llc | $195,000 | -- |
Source: Public Records
Mortgage History
| Date | Status | Borrower | Loan Amount |
|---|---|---|---|
| Open | Neary 1 Llc | $888,750 | |
| Closed | Neary 1 Llc | $650,000 | |
| Closed | Neary 1 Llc | $400,000 | |
| Closed | Neary 1 Llc | $156,000 |
Source: Public Records
Tax History Compared to Growth
Tax History
| Year | Tax Paid | Tax Assessment Tax Assessment Total Assessment is a certain percentage of the fair market value that is determined by local assessors to be the total taxable value of land and additions on the property. | Land | Improvement |
|---|---|---|---|---|
| 2025 | $25,001 | $634,550 | $30,800 | $603,750 |
| 2024 | $24,430 | $634,550 | $30,800 | $603,750 |
| 2023 | $23,605 | $634,550 | $30,800 | $603,750 |
| 2022 | $25,223 | $634,550 | $30,800 | $603,750 |
| 2021 | $23,728 | $540,750 | $24,640 | $516,110 |
| 2020 | $23,728 | $540,750 | $24,640 | $516,110 |
| 2019 | $23,241 | $540,750 | $24,640 | $516,110 |
| 2018 | $23,241 | $540,750 | $24,640 | $516,110 |
| 2017 | $20,916 | $540,750 | $24,640 | $516,110 |
| 2016 | $19,184 | $461,720 | $16,450 | $445,270 |
| 2015 | $19,184 | $461,720 | $16,450 | $445,270 |
| 2014 | $19,184 | $461,720 | $16,450 | $445,270 |
Source: Public Records
Map
Nearby Homes