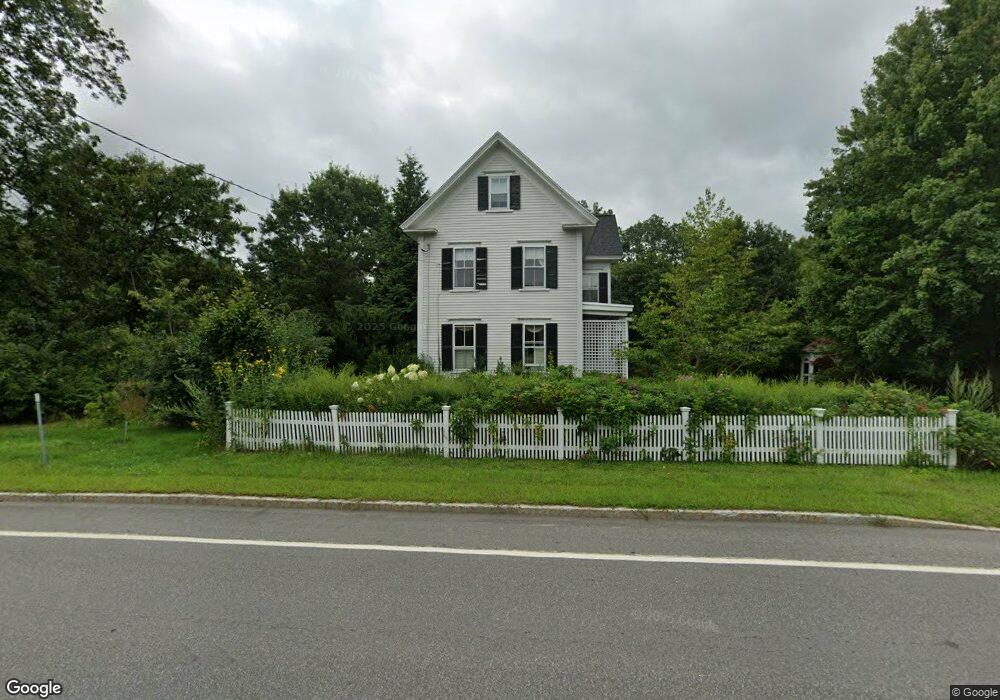
27 Main St Newfields, NH 03856
Estimated Value: $723,000 - $1,139,000
2
Beds
2
Baths
3,550
Sq Ft
$261/Sq Ft
Est. Value
About This Home
This home is located at 27 Main St, Newfields, NH 03856 and is currently estimated at $924,896, approximately $260 per square foot. 27 Main St is a home located in Rockingham County with nearby schools including Cooperative Middle School, Exeter High School, and Cornerstone Christian Academy.
Ownership History
Date
Name
Owned For
Owner Type
Purchase Details
Closed on
Apr 17, 2003
Sold by
Abrahamson Leonard W and Abrahamson Josephine R
Bought by
Bell Billie Joyce and Bell Milton R
Current Estimated Value
Home Financials for this Owner
Home Financials are based on the most recent Mortgage that was taken out on this home.
Original Mortgage
$304,000
Interest Rate
5.75%
Create a Home Valuation Report for This Property
The Home Valuation Report is an in-depth analysis detailing your home's value as well as a comparison with similar homes in the area
Home Values in the Area
Average Home Value in this Area
Purchase History
| Date | Buyer | Sale Price | Title Company |
|---|---|---|---|
| Bell Billie Joyce | $380,000 | -- |
Source: Public Records
Mortgage History
| Date | Status | Borrower | Loan Amount |
|---|---|---|---|
| Open | Bell Billie Joyce | $416,500 | |
| Closed | Bell Billie Joyce | $416,500 | |
| Closed | Bell Billie Joyce | $304,000 |
Source: Public Records
Tax History Compared to Growth
Tax History
| Year | Tax Paid | Tax Assessment Tax Assessment Total Assessment is a certain percentage of the fair market value that is determined by local assessors to be the total taxable value of land and additions on the property. | Land | Improvement |
|---|---|---|---|---|
| 2024 | $13,257 | $823,900 | $241,600 | $582,300 |
| 2023 | $13,009 | $823,900 | $241,600 | $582,300 |
| 2022 | $12,044 | $574,600 | $179,900 | $394,700 |
| 2021 | $11,808 | $574,600 | $179,900 | $394,700 |
| 2020 | $12,205 | $574,600 | $179,900 | $394,700 |
| 2019 | $11,831 | $574,600 | $179,900 | $394,700 |
| 2018 | $11,579 | $583,300 | $188,600 | $394,700 |
| 2017 | $11,829 | $494,100 | $182,500 | $311,600 |
| 2016 | $12,047 | $518,800 | $182,500 | $336,300 |
| 2015 | $11,948 | $518,800 | $182,500 | $336,300 |
| 2014 | $12,581 | $518,800 | $182,500 | $336,300 |
| 2013 | $12,538 | $516,400 | $182,500 | $333,900 |
Source: Public Records
Map
Nearby Homes
- 85 College Rd
- 9 Swamscott St
- 3 Swamscott St
- 11 Old Lee Rd
- 4 Kildary Dr
- 34 Kinloch Dr
- 40 Stratham Green
- 60 Peninsula Dr
- 30 Honeycomb Way
- 104 Piscassic Rd
- 23 Winding Brook Dr
- 54 Brookside Dr
- 5 Brookside Dr
- 217 Portsmouth Ave
- 325 Lita Ln
- 227 Portsmouth Ave
- 4 Sloans Brook Dr
- 156 Piscassic Rd
- 00 Piscassic & Oaklands Rd Unit 1
- 8 Stonewall Way