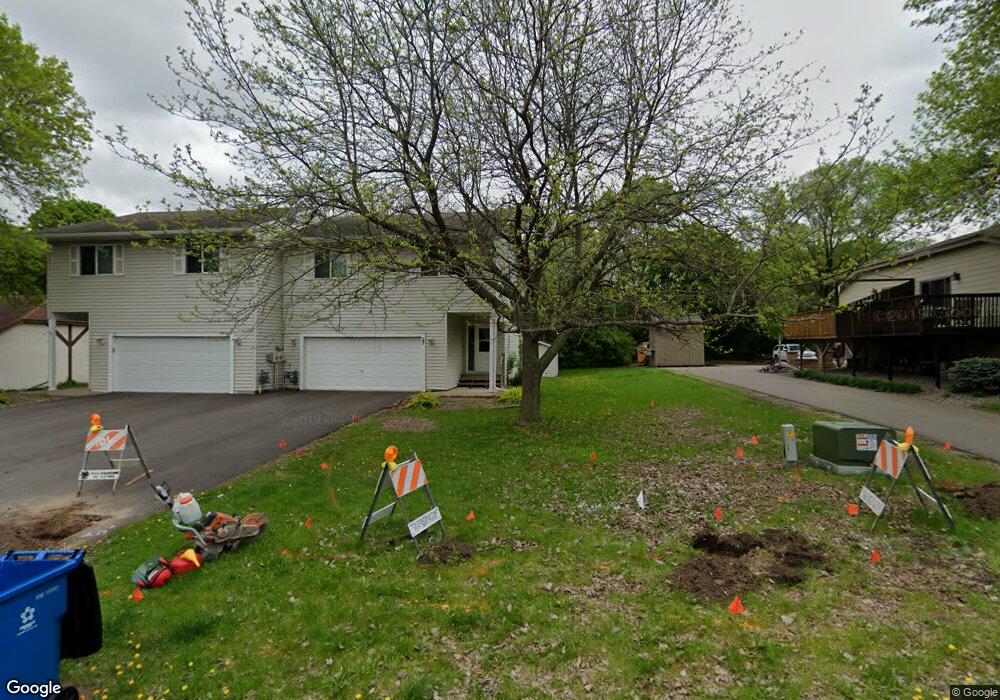
27 Maple Island Rd Burnsville, MN 55306
Estimated Value: $321,000 - $344,000
4
Beds
2
Baths
1,736
Sq Ft
$190/Sq Ft
Est. Value
About This Home
This home is located at 27 Maple Island Rd, Burnsville, MN 55306 and is currently estimated at $329,628, approximately $189 per square foot. 27 Maple Island Rd is a home located in Dakota County with nearby schools including Oak Hills Elementary School, Kenwood Trail Middle School, and Lakeville North High School.
Ownership History
Date
Name
Owned For
Owner Type
Purchase Details
Closed on
Apr 21, 2021
Sold by
Wels Theresa and Wels Darren
Bought by
Lyons Victoria and Lyons Scott
Current Estimated Value
Home Financials for this Owner
Home Financials are based on the most recent Mortgage that was taken out on this home.
Original Mortgage
$265,821
Outstanding Balance
$240,196
Interest Rate
3.05%
Mortgage Type
FHA
Estimated Equity
$89,432
Purchase Details
Closed on
Sep 29, 2017
Sold by
Doyle Lisa K and Doyle Brian B
Bought by
Wels Darren and Wels Theresa
Home Financials for this Owner
Home Financials are based on the most recent Mortgage that was taken out on this home.
Original Mortgage
$211,105
Interest Rate
3.75%
Mortgage Type
FHA
Purchase Details
Closed on
Jan 29, 2016
Sold by
Doyle Brian B and Doyle Charles P
Bought by
Doyle Brian B
Purchase Details
Closed on
Mar 2, 2000
Sold by
Elfering Robert H and Elfering Nancy A
Bought by
Doyle Charles P
Create a Home Valuation Report for This Property
The Home Valuation Report is an in-depth analysis detailing your home's value as well as a comparison with similar homes in the area
Home Values in the Area
Average Home Value in this Area
Purchase History
| Date | Buyer | Sale Price | Title Company |
|---|---|---|---|
| Lyons Victoria | $285,000 | Watermark Title Agency | |
| Wels Darren | $215,000 | Edina Realty Title Inc | |
| Doyle Brian B | -- | Attorney | |
| Doyle Charles P | $272,000 | -- |
Source: Public Records
Mortgage History
| Date | Status | Borrower | Loan Amount |
|---|---|---|---|
| Open | Lyons Victoria | $265,821 | |
| Previous Owner | Wels Darren | $211,105 |
Source: Public Records
Tax History Compared to Growth
Tax History
| Year | Tax Paid | Tax Assessment Tax Assessment Total Assessment is a certain percentage of the fair market value that is determined by local assessors to be the total taxable value of land and additions on the property. | Land | Improvement |
|---|---|---|---|---|
| 2024 | $3,196 | $271,500 | $57,800 | $213,700 |
| 2023 | $3,196 | $271,400 | $57,800 | $213,600 |
| 2022 | $2,896 | $275,500 | $48,800 | $226,700 |
| 2021 | $2,676 | $233,200 | $42,500 | $190,700 |
| 2020 | $2,650 | $218,900 | $40,500 | $178,400 |
| 2019 | $2,318 | $207,600 | $38,500 | $169,100 |
| 2018 | $2,000 | $190,000 | $36,700 | $153,300 |
| 2017 | $2,236 | $166,200 | $34,900 | $131,300 |
| 2016 | $2,410 | $161,700 | $33,300 | $128,400 |
| 2015 | $2,040 | $167,600 | $32,300 | $135,300 |
| 2014 | -- | $149,800 | $31,700 | $118,100 |
| 2013 | -- | $136,600 | $29,000 | $107,600 |
Source: Public Records
Map
Nearby Homes
- 16045 Oak Shore Dr
- 101 Oak Shore Dr
- 10435 163rd St W
- 1005 Hilloway Cir
- 16357 Java Ln
- 313 Maple Island Rd
- 16365 Javari Ct
- 16344 Jatos Cir
- 333 Maple Island Rd
- 9955 161st St W
- 594 Stonewood Ln
- 15455 Fremont Ave S
- 15250 Stevens Ave
- 1312 Fremont Ct
- 344 Stonewood Place
- 16415 Jaffna Place
- 16386 Jaffna Place
- 600 Greenhaven Dr Unit 213
- 15100 Eileen Cir
- 15203 Greenhaven Way
- 25 Maple Island Rd
- 31 Maple Island Rd
- 29 Maple Island Rd
- 21 Maple Island Rd
- 35 Maple Island Rd
- 33 Maple Island Rd
- 46 Maple Island Rd
- 44 Maple Island Rd
- 52 Maple Island Rd
- 38 Maple Island Rd
- 16005 Joplin Ave
- 36 Maple Island Rd
- 54 Maple Island Rd
- 30 Maple Island Rd
- 42 Maple Island Rd
- 48 Maple Island Rd
- 40 Maple Island Rd
- 50 Maple Island Rd
- 56 Maple Island Rd
- 16045 Joplin Ave