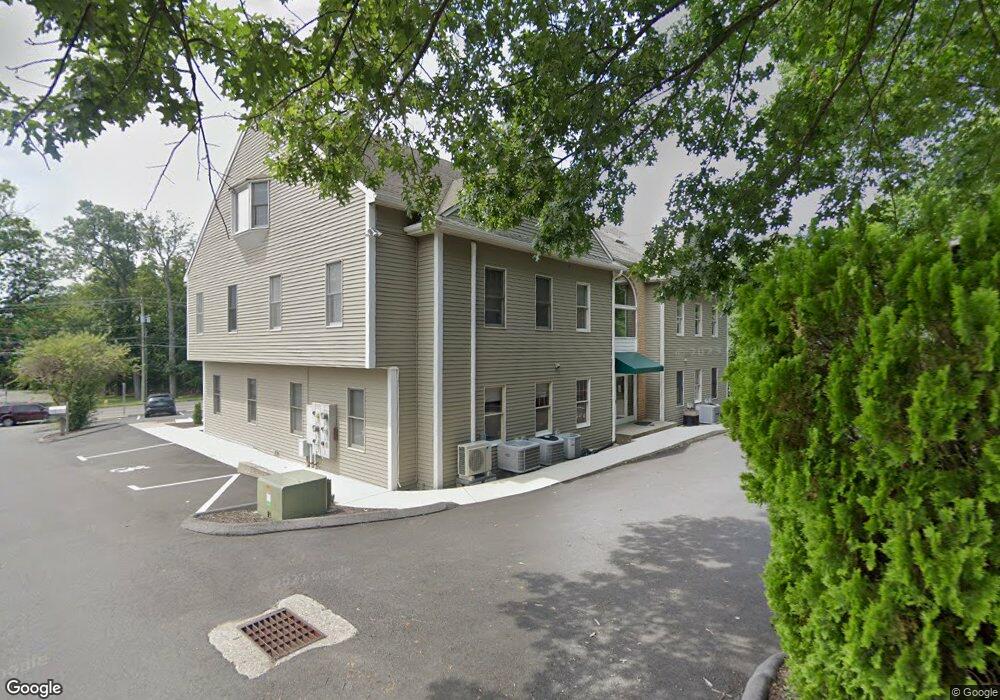
27 Mill Plain Rd Unit 4LOFT Danbury, CT 06811
Estimated Value: $590,050
Studio
--
Bath
2,397
Sq Ft
$246/Sq Ft
Est. Value
About This Home
This home is located at 27 Mill Plain Rd Unit 4LOFT, Danbury, CT 06811 and is currently estimated at $590,050, approximately $246 per square foot. 27 Mill Plain Rd Unit 4LOFT is a home located in Fairfield County with nearby schools including Mill Ridge Primary School, Rogers Park Middle School, and Danbury High School.
Ownership History
Date
Name
Owned For
Owner Type
Purchase Details
Closed on
Aug 11, 2014
Sold by
Mehta Mohan L and Mehta Asha
Bought by
Scott Richard G and Orr Deborah
Current Estimated Value
Purchase Details
Closed on
Apr 5, 2012
Sold by
Rggn Realty Llc
Bought by
Mehta Mohan L and Mehta Asha
Purchase Details
Closed on
Oct 20, 2005
Sold by
Ellis Christine and Trattner Jeffrey
Bought by
Rggn Rlty Llc
Home Financials for this Owner
Home Financials are based on the most recent Mortgage that was taken out on this home.
Original Mortgage
$267,750
Interest Rate
5.72%
Mortgage Type
Commercial
Purchase Details
Closed on
Nov 1, 1991
Sold by
New Milford Svg Bk
Bought by
Trattner Jeffrey and Ellis Christine
Home Financials for this Owner
Home Financials are based on the most recent Mortgage that was taken out on this home.
Original Mortgage
$130,000
Interest Rate
8.9%
Mortgage Type
Commercial
Create a Home Valuation Report for This Property
The Home Valuation Report is an in-depth analysis detailing your home's value as well as a comparison with similar homes in the area
Home Values in the Area
Average Home Value in this Area
Purchase History
| Date | Buyer | Sale Price | Title Company |
|---|---|---|---|
| Scott Richard G | $342,500 | -- | |
| Scott Richard G | $342,500 | -- | |
| Mehta Mohan L | $305,000 | -- | |
| Mehta Mohan L | $305,000 | -- | |
| Rggn Rlty Llc | $315,000 | -- | |
| Rggn Rlty Llc | $315,000 | -- | |
| Trattner Jeffrey | $150,000 | -- |
Source: Public Records
Mortgage History
| Date | Status | Borrower | Loan Amount |
|---|---|---|---|
| Previous Owner | Trattner Jeffrey | $267,750 | |
| Previous Owner | Trattner Jeffrey | $130,000 |
Source: Public Records
Tax History
| Year | Tax Paid | Tax Assessment Tax Assessment Total Assessment is a certain percentage of the fair market value that is determined by local assessors to be the total taxable value of land and additions on the property. | Land | Improvement |
|---|---|---|---|---|
| 2025 | $5,418 | $216,790 | $0 | $216,790 |
| 2024 | $5,298 | $216,790 | $0 | $216,790 |
| 2023 | $5,058 | $216,790 | $0 | $216,790 |
| 2022 | $6,510 | $230,700 | $0 | $230,700 |
| 2021 | $6,367 | $230,700 | $0 | $230,700 |
| 2020 | $6,367 | $230,700 | $0 | $230,700 |
| 2019 | $6,367 | $230,700 | $0 | $230,700 |
| 2018 | $6,367 | $230,700 | $0 | $230,700 |
| 2017 | $6,051 | $209,000 | $0 | $209,000 |
| 2016 | $5,994 | $209,000 | $0 | $209,000 |
| 2015 | $5,906 | $209,000 | $0 | $209,000 |
| 2014 | $5,768 | $209,000 | $0 | $209,000 |
Source: Public Records
Map
Nearby Homes
- 55 Mill Plain Rd Unit 17-6
- 2 Greenlawn Dr
- 12 Boulevard Dr Unit 15-104
- 12 Boulevard Dr Unit 31-172
- 1603 Briar Woods Ln
- 11 Boulevard Dr Unit 13
- 23 Scuppo Rd Unit 5-7
- 1 Wilderswood Way
- 403 Larson Dr
- 46 Kenosia Ave Unit 26
- 46 Kenosia Ave Unit 30
- 12 Scuppo Rd Unit D4
- 40 Middle River Rd
- 2 Rolf Dr
- 17 Staples St
- 22 Irving Place
- 67 B Westville Ave
- 1025 Country View Rd Unit 1025
- 140 Franklin Street Extension
- 3 Thorncrest Ridge
- 27 Mill Plain Rd Unit 1
- 27 Mill Plain Rd Unit 2
- 27 Mill Plain Rd Unit 4
- 1 Watson Dr
- 2 Watson Dr
- 24 Mill Plain Rd
- 34 Mill Plain Rd Unit 1
- 34 Mill Plain Rd
- 26 Mill Plain Rd
- 26 Mill Plain Rd Unit 2E
- 26 Mill Plain Rd Unit 2B
- 21 Mill Plain Rd
- 1 Woodland Hill Rd
- 36 Mill Plain Rd Unit 203
- 36 Mill Plain Rd Unit 207
- 36 Mill Plain Rd Unit 205
- 36 Mill Plain Rd Unit 309
- 36 Mill Plain Rd Unit 208
- 36 Mill Plain Rd Unit 306
- 36 Mill Plain Rd Unit 205
Your Personal Tour Guide
Ask me questions while you tour the home.