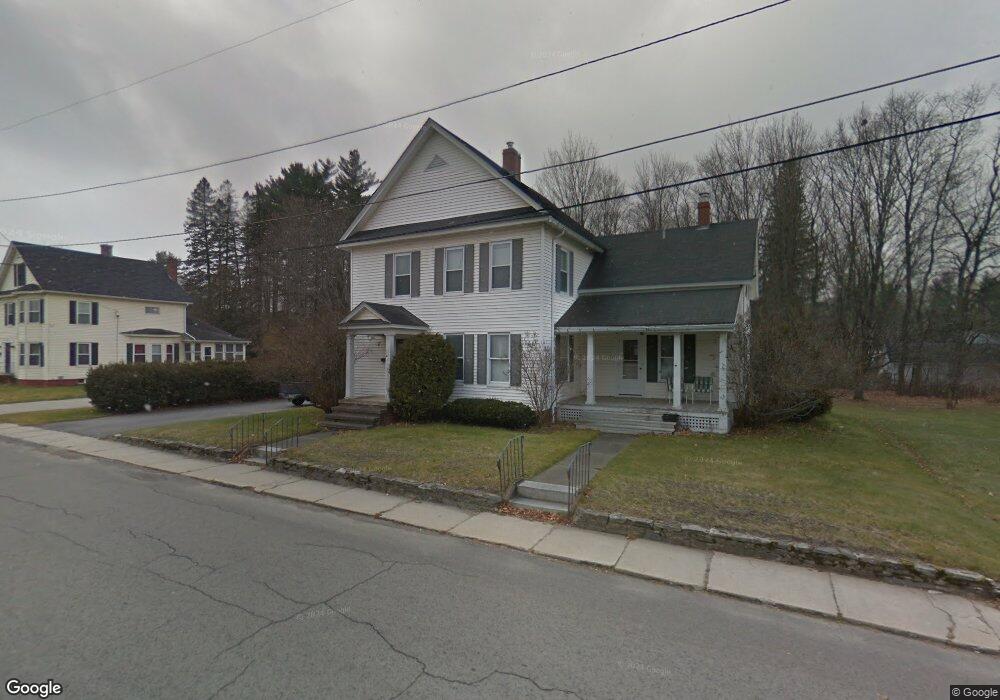
27 Monadnock St Colebrook, NH 03576
Estimated Value: $256,000 - $309,000
3
Beds
2
Baths
2,440
Sq Ft
$119/Sq Ft
Est. Value
About This Home
This home is located at 27 Monadnock St, Colebrook, NH 03576 and is currently estimated at $290,912, approximately $119 per square foot. 27 Monadnock St is a home located in Coos County with nearby schools including Colebrook Elementary School, Colebrook Academy, and Camp E-Toh-Anee.
Ownership History
Date
Name
Owned For
Owner Type
Purchase Details
Closed on
Nov 20, 2015
Sold by
Allen Isaac T
Bought by
Allen Isaac T and Allen Cassandra L
Current Estimated Value
Purchase Details
Closed on
Feb 13, 2004
Sold by
Montague Bradley R
Bought by
Allen Isaac Terry and Allen Karen Lea
Home Financials for this Owner
Home Financials are based on the most recent Mortgage that was taken out on this home.
Original Mortgage
$89,900
Interest Rate
5.82%
Mortgage Type
Purchase Money Mortgage
Create a Home Valuation Report for This Property
The Home Valuation Report is an in-depth analysis detailing your home's value as well as a comparison with similar homes in the area
Purchase History
| Date | Buyer | Sale Price | Title Company |
|---|---|---|---|
| Allen Isaac T | -- | -- | |
| Allen Isaac Terry | $129,900 | -- |
Source: Public Records
Mortgage History
| Date | Status | Borrower | Loan Amount |
|---|---|---|---|
| Previous Owner | Allen Isaac Terry | $89,900 |
Source: Public Records
Tax History
| Year | Tax Paid | Tax Assessment Tax Assessment Total Assessment is a certain percentage of the fair market value that is determined by local assessors to be the total taxable value of land and additions on the property. | Land | Improvement |
|---|---|---|---|---|
| 2024 | $4,557 | $130,300 | $22,100 | $108,200 |
| 2023 | $4,125 | $130,300 | $22,100 | $108,200 |
| 2022 | $3,690 | $130,300 | $22,100 | $108,200 |
| 2021 | $3,620 | $130,300 | $22,100 | $108,200 |
| 2020 | $1,139 | $130,300 | $22,100 | $108,200 |
| 2019 | $3,926 | $130,300 | $22,100 | $108,200 |
| 2018 | $860 | $137,500 | $22,100 | $115,400 |
| 2017 | $4,055 | $137,500 | $22,100 | $115,400 |
| 2016 | $3,920 | $137,500 | $22,100 | $115,400 |
| 2015 | $3,972 | $137,500 | $22,100 | $115,400 |
| 2014 | $3,981 | $137,500 | $22,100 | $115,400 |
| 2013 | $3,553 | $154,000 | $30,200 | $123,800 |
Source: Public Records
Map
Nearby Homes
Your Personal Tour Guide
Ask me questions while you tour the home.