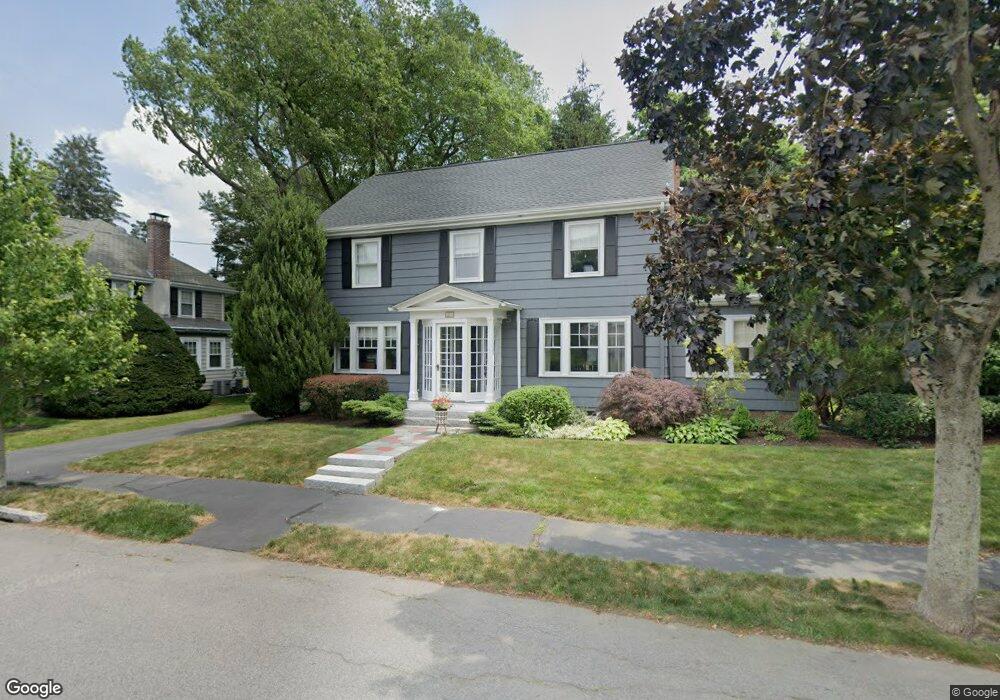
27 Morton Rd Swampscott, MA 01907
Estimated Value: $1,202,829 - $1,316,000
5
Beds
4
Baths
2,450
Sq Ft
$510/Sq Ft
Est. Value
About This Home
This home is located at 27 Morton Rd, Swampscott, MA 01907 and is currently estimated at $1,249,707, approximately $510 per square foot. 27 Morton Rd is a home located in Essex County with nearby schools including Swampscott Middle School, Swampscott High School, and Devereux School.
Ownership History
Date
Name
Owned For
Owner Type
Purchase Details
Closed on
Sep 2, 2005
Sold by
Leger Pamela I and Leger Richard E
Bought by
Nassar Kimberly S
Current Estimated Value
Create a Home Valuation Report for This Property
The Home Valuation Report is an in-depth analysis detailing your home's value as well as a comparison with similar homes in the area
Home Values in the Area
Average Home Value in this Area
Purchase History
| Date | Buyer | Sale Price | Title Company |
|---|---|---|---|
| Nassar Kimberly S | $600,000 | -- | |
| Nassar Kimberly S | $600,000 | -- |
Source: Public Records
Mortgage History
| Date | Status | Borrower | Loan Amount |
|---|---|---|---|
| Previous Owner | Nassar Kimberly S | $520,000 | |
| Previous Owner | Nassar Kimberly S | $395,000 |
Source: Public Records
Tax History
| Year | Tax Paid | Tax Assessment Tax Assessment Total Assessment is a certain percentage of the fair market value that is determined by local assessors to be the total taxable value of land and additions on the property. | Land | Improvement |
|---|---|---|---|---|
| 2025 | $10,892 | $949,600 | $377,700 | $571,900 |
| 2024 | $10,583 | $921,100 | $359,300 | $561,800 |
| 2023 | $9,975 | $849,700 | $322,400 | $527,300 |
| 2022 | $9,516 | $741,700 | $276,400 | $465,300 |
| 2021 | $9,036 | $654,800 | $258,000 | $396,800 |
| 2020 | $9,278 | $648,800 | $257,900 | $390,900 |
| 2019 | $9,582 | $630,400 | $239,500 | $390,900 |
| 2018 | $9,851 | $615,700 | $239,500 | $376,200 |
| 2017 | $10,011 | $573,700 | $221,100 | $352,600 |
| 2016 | $9,823 | $566,800 | $214,200 | $352,600 |
| 2015 | $9,721 | $566,800 | $214,200 | $352,600 |
| 2014 | $9,924 | $530,700 | $214,200 | $316,500 |
Source: Public Records
Map
Nearby Homes
- 2 Ocean Ave
- 48 Bellevue Rd
- 35 Alden Rd
- 212 Humphrey St Unit 205
- 22 Hemenway Rd
- 71 Walnut Rd
- 1002 Paradise Rd Unit PHE
- 1004 Paradise Rd Unit 1L
- 10 Arbutus Rd
- 11 Angenica Terrace
- 3 Didio Dr
- 25 Tedesco St
- 110 Galloupes Point Rd
- 51 Mountwood Rd
- 50 Mountwood Rd
- 12 Pickwick Rd
- 75 Bay View Dr
- 1 Bond St
- 445 Essex St Unit 304
- 441 Essex St Unit 302
Your Personal Tour Guide
Ask me questions while you tour the home.