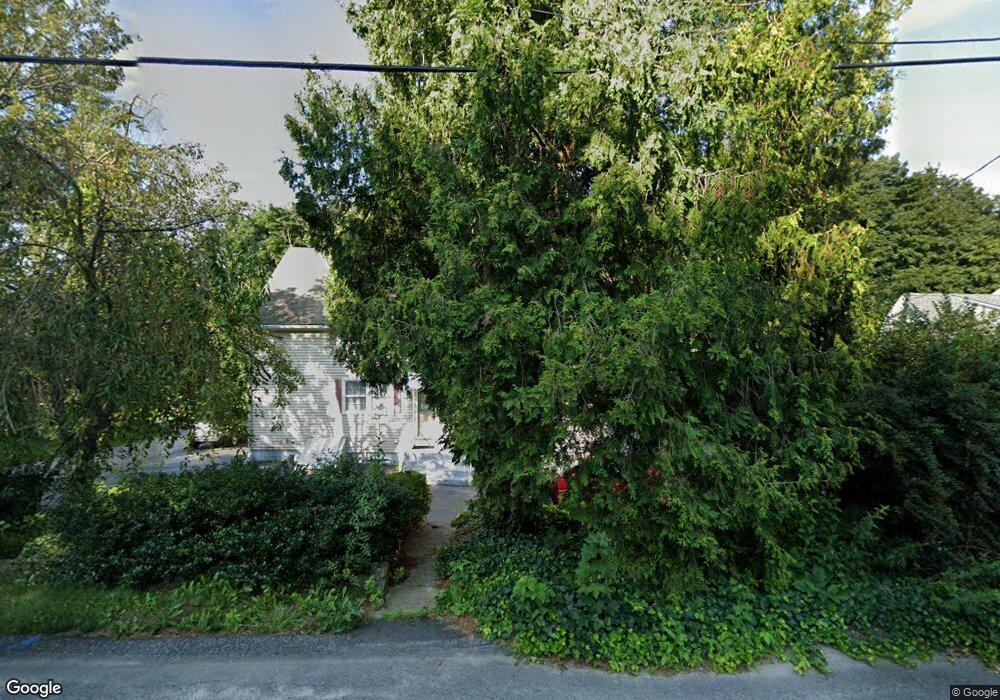
27 Mount Pleasant View Ave Cumberland, RI 02864
Cumberland Hill NeighborhoodEstimated Value: $505,429 - $670,000
5
Beds
2
Baths
2,093
Sq Ft
$278/Sq Ft
Est. Value
About This Home
This home is located at 27 Mount Pleasant View Ave, Cumberland, RI 02864 and is currently estimated at $581,607, approximately $277 per square foot. 27 Mount Pleasant View Ave is a home located in Providence County with nearby schools including John J. McLaughlin Cumberland Hill School, North Cumberland Middle School, and Cumberland High School.
Ownership History
Date
Name
Owned For
Owner Type
Purchase Details
Closed on
Sep 29, 2016
Sold by
Haleys Llc
Bought by
Neil Christopher T and Neil Duo T
Current Estimated Value
Home Financials for this Owner
Home Financials are based on the most recent Mortgage that was taken out on this home.
Original Mortgage
$217,500
Outstanding Balance
$174,201
Interest Rate
3.43%
Mortgage Type
Purchase Money Mortgage
Estimated Equity
$407,406
Purchase Details
Closed on
Sep 12, 2016
Sold by
Haleys Llc
Bought by
Haleys Llc
Home Financials for this Owner
Home Financials are based on the most recent Mortgage that was taken out on this home.
Original Mortgage
$217,500
Outstanding Balance
$174,201
Interest Rate
3.43%
Mortgage Type
Purchase Money Mortgage
Estimated Equity
$407,406
Purchase Details
Closed on
Dec 4, 2015
Sold by
Menard Gloria B
Bought by
Haleys Llc
Purchase Details
Closed on
Oct 17, 2003
Sold by
Dumais Wallace A
Bought by
Bernier Brian K
Create a Home Valuation Report for This Property
The Home Valuation Report is an in-depth analysis detailing your home's value as well as a comparison with similar homes in the area
Home Values in the Area
Average Home Value in this Area
Purchase History
| Date | Buyer | Sale Price | Title Company |
|---|---|---|---|
| Neil Christopher T | $290,000 | -- | |
| Haleys Llc | -- | -- | |
| Haleys Llc | -- | -- | |
| Haleys Llc | -- | -- | |
| Haleys Llc | $240,000 | -- | |
| Bernier Brian K | $600,000 | -- |
Source: Public Records
Mortgage History
| Date | Status | Borrower | Loan Amount |
|---|---|---|---|
| Open | Bernier Brian K | $217,500 | |
| Closed | Bernier Brian K | $234,500 |
Source: Public Records
Tax History Compared to Growth
Tax History
| Year | Tax Paid | Tax Assessment Tax Assessment Total Assessment is a certain percentage of the fair market value that is determined by local assessors to be the total taxable value of land and additions on the property. | Land | Improvement |
|---|---|---|---|---|
| 2025 | $5,069 | $413,100 | $161,900 | $251,200 |
| 2024 | $4,937 | $413,100 | $161,900 | $251,200 |
| 2023 | $4,800 | $413,100 | $161,900 | $251,200 |
| 2022 | $4,722 | $315,000 | $115,400 | $199,600 |
| 2021 | $4,643 | $315,000 | $115,400 | $199,600 |
| 2020 | $4,511 | $315,000 | $115,400 | $199,600 |
| 2019 | $4,440 | $279,600 | $97,500 | $182,100 |
| 2018 | $555 | $279,600 | $97,500 | $182,100 |
| 2017 | $4,253 | $279,600 | $97,500 | $182,100 |
| 2016 | $3,898 | $228,200 | $93,300 | $134,900 |
| 2015 | $3,898 | $228,200 | $93,300 | $134,900 |
| 2014 | $3,898 | $228,200 | $93,300 | $134,900 |
| 2013 | $3,639 | $230,600 | $93,300 | $137,300 |
Source: Public Records
Map
Nearby Homes
- 25 Manville Hill Rd
- 200 Heroux Blvd Unit 606
- 2 Angle St Unit 5
- 200 Manville Hill Rd Unit 64
- 125 Main St
- 13 Plant St
- 12 Dulles St
- 45 Rose Ln
- 40 Warren Ave
- 49 Branch Ave
- 19 Marques St
- 45 Valley View Dr
- 5 Edgewood Ave
- 0 Acorn St
- 253 Central St
- 33 Sandy Way
- 252 Railroad St
- 106 Canning St
- 2970 Mendon Rd Unit 139
- 2970 Mendon Rd Unit 84
- 27 Mt Pleasant View
- 27 Mt Pleasant View Ave
- 28 Mt Pleasant View Ave
- 28 Mount Pleasant View Ave
- 43 Mount Pleasant View Ave
- 36 Mount Pleasant View Ave
- 23 Mount Pleasant View Ave
- 17 Mt Pleasant View Ave Unit A
- 17 Mt Pleasant View Ave Unit D
- 17 Mt Pleasant View Ave Unit B
- 17 Mt Pleasant View Ave Unit C
- 17 Mount Pleasant View Ave Unit 17 A
- 17 Mount Pleasant View Ave
- 17 Mount Pleasant View Ave Unit 17C
- 22 Mount Pleasant View Ave
- 20 Mount Pleasant View Ave
- 45 Mount Pleasant View Ave
- 20 Boyle Ave
- 48 Mount Pleasant View Ave
- 18 Boyle Ave Unit B