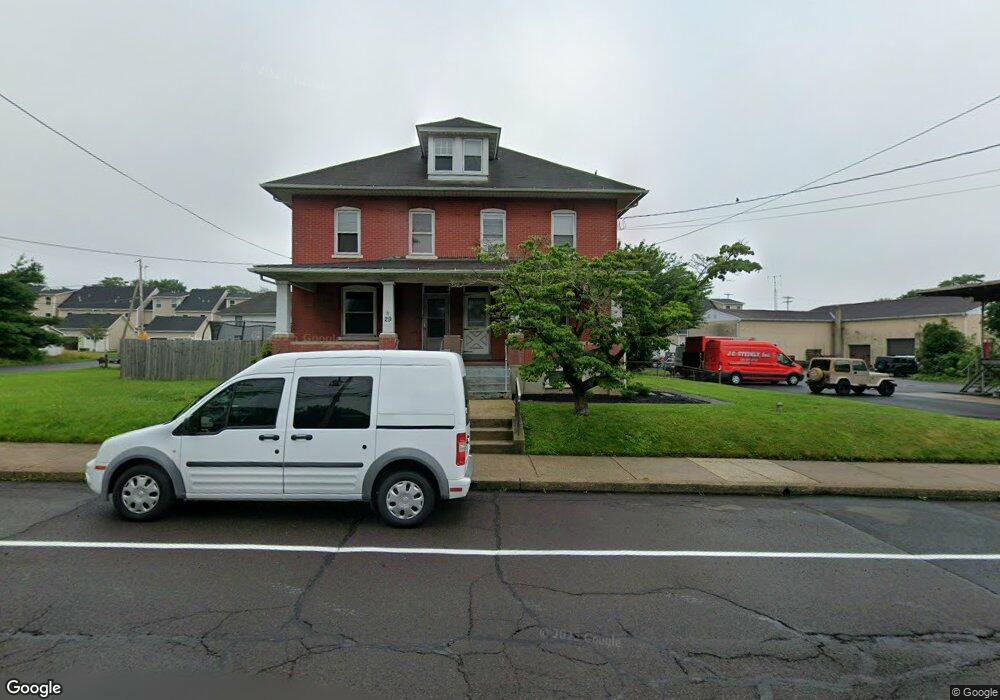
27 N 9th St Perkasie, PA 18944
East Rockhill NeighborhoodEstimated Value: $253,000 - $373,560
4
Beds
1
Bath
1,909
Sq Ft
$168/Sq Ft
Est. Value
About This Home
This home is located at 27 N 9th St, Perkasie, PA 18944 and is currently estimated at $320,140, approximately $167 per square foot. 27 N 9th St is a home located in Bucks County with nearby schools including Pennridge High School, Upper Bucks Christian School, and Community Service Foundation.
Ownership History
Date
Name
Owned For
Owner Type
Purchase Details
Closed on
May 17, 2022
Sold by
Mele Jr Randall S
Bought by
Trivino Michael A and Trivino Alyssa M
Current Estimated Value
Home Financials for this Owner
Home Financials are based on the most recent Mortgage that was taken out on this home.
Original Mortgage
$194,000
Outstanding Balance
$184,378
Interest Rate
5.3%
Mortgage Type
Balloon
Estimated Equity
$135,762
Purchase Details
Closed on
Mar 14, 2012
Sold by
Stubbs Ronald R
Bought by
Mele Randall S
Home Financials for this Owner
Home Financials are based on the most recent Mortgage that was taken out on this home.
Original Mortgage
$130,000
Interest Rate
3.86%
Mortgage Type
New Conventional
Purchase Details
Closed on
Dec 6, 2011
Sold by
Mele Louis
Bought by
Mele Randall S
Purchase Details
Closed on
Nov 1, 1962
Bought by
Stubbs George F and Stubbs Beatrice
Create a Home Valuation Report for This Property
The Home Valuation Report is an in-depth analysis detailing your home's value as well as a comparison with similar homes in the area
Home Values in the Area
Average Home Value in this Area
Purchase History
| Date | Buyer | Sale Price | Title Company |
|---|---|---|---|
| Trivino Michael A | $200,000 | None Listed On Document | |
| Mele Randall S | $162,500 | None Available | |
| Mele Randall S | -- | None Available | |
| Stubbs George F | -- | -- |
Source: Public Records
Mortgage History
| Date | Status | Borrower | Loan Amount |
|---|---|---|---|
| Open | Trivino Michael A | $194,000 | |
| Previous Owner | Mele Randall S | $130,000 |
Source: Public Records
Tax History Compared to Growth
Tax History
| Year | Tax Paid | Tax Assessment Tax Assessment Total Assessment is a certain percentage of the fair market value that is determined by local assessors to be the total taxable value of land and additions on the property. | Land | Improvement |
|---|---|---|---|---|
| 2025 | $3,302 | $19,200 | $4,400 | $14,800 |
| 2024 | $3,302 | $19,200 | $4,400 | $14,800 |
| 2023 | $3,263 | $19,200 | $4,400 | $14,800 |
| 2022 | $3,263 | $19,200 | $4,400 | $14,800 |
| 2021 | $3,206 | $19,200 | $4,400 | $14,800 |
| 2020 | $3,206 | $19,200 | $4,400 | $14,800 |
| 2019 | $3,186 | $19,200 | $4,400 | $14,800 |
| 2018 | $3,186 | $19,200 | $4,400 | $14,800 |
| 2017 | $3,162 | $19,200 | $4,400 | $14,800 |
| 2016 | $3,162 | $19,200 | $4,400 | $14,800 |
| 2015 | -- | $19,200 | $4,400 | $14,800 |
| 2014 | -- | $19,200 | $4,400 | $14,800 |
Source: Public Records
Map
Nearby Homes
- 40 N 8th St Unit HOMESITE B20
- 44 N 8th St Unit HOMESITE B22
- 46 N 8th St Unit HOMESITE B23
- 48 N 8th St Unit HOMESITE B24
- 50 N 8th St Unit HOMESITE B25
- 52 N 8th St Unit HOMESITE B26
- 54 N 8th St Unit HOMESITE B27
- 42 S 8th St Unit HOMESITE 21
- 912 Arch St
- 604 W Walnut St
- 258 N 4th St
- Newhaven Grand Plan at Green Ridge Estates East
- Sutton Plan at Green Ridge Estates East
- 326 N 5th St
- 205 Parkridge Dr
- 42 Independence Ct
- 504 S 4th St
- 11B Fairview Ave
- Newhaven Grand Plan at Green Ridge Estates West
- Sutton Plan at Green Ridge Estates West