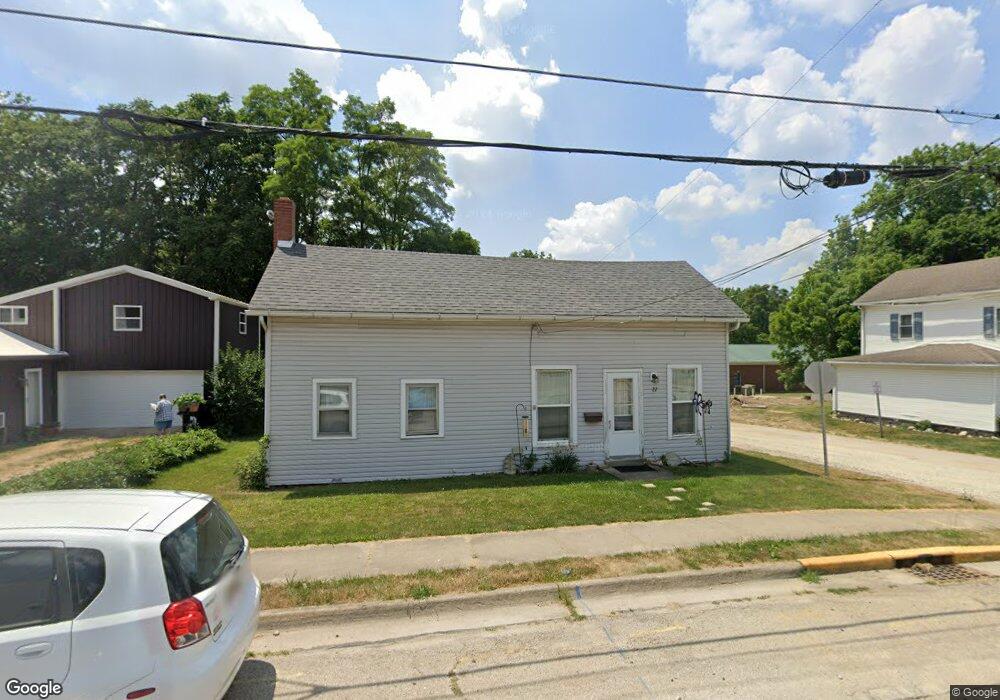
27 N Main St Covington, OH 45318
Estimated Value: $78,000 - $143,000
2
Beds
1
Bath
3,276
Sq Ft
$32/Sq Ft
Est. Value
About This Home
This home is located at 27 N Main St, Covington, OH 45318 and is currently estimated at $104,516, approximately $31 per square foot. 27 N Main St is a home located in Miami County with nearby schools including Covington Elementary/Junior High School, Covington Junior High School, and Covington High School.
Ownership History
Date
Name
Owned For
Owner Type
Purchase Details
Closed on
Oct 15, 2021
Sold by
Boone Simon L and Boone Gwen E
Bought by
Boone Simon L and Boone Gwen E
Current Estimated Value
Purchase Details
Closed on
Oct 2, 2017
Sold by
Collier Kenna K
Bought by
Boone Simon L
Home Financials for this Owner
Home Financials are based on the most recent Mortgage that was taken out on this home.
Original Mortgage
$25,600
Outstanding Balance
$17,109
Interest Rate
3.78%
Mortgage Type
Adjustable Rate Mortgage/ARM
Estimated Equity
$87,408
Purchase Details
Closed on
Mar 22, 2012
Sold by
Brandt John A
Bought by
Collier Kenna K
Purchase Details
Closed on
Mar 20, 2012
Sold by
Brandt John A
Bought by
Collier Kenna K
Purchase Details
Closed on
Jan 31, 2012
Sold by
Brandt Jane A and Brandt Jane Anne
Bought by
Brandt John A and Collier Kenna K
Purchase Details
Closed on
Jan 1, 1990
Bought by
Brandt Jane Anne
Create a Home Valuation Report for This Property
The Home Valuation Report is an in-depth analysis detailing your home's value as well as a comparison with similar homes in the area
Home Values in the Area
Average Home Value in this Area
Purchase History
| Date | Buyer | Sale Price | Title Company |
|---|---|---|---|
| Boone Simon L | -- | None Available | |
| Boone Simon L | $37,500 | -- | |
| Collier Kenna K | -- | -- | |
| Collier Kenna K | -- | -- | |
| Brandt John A | -- | -- | |
| Brandt Jane Anne | -- | -- |
Source: Public Records
Mortgage History
| Date | Status | Borrower | Loan Amount |
|---|---|---|---|
| Open | Boone Simon L | $25,600 |
Source: Public Records
Tax History
| Year | Tax Paid | Tax Assessment Tax Assessment Total Assessment is a certain percentage of the fair market value that is determined by local assessors to be the total taxable value of land and additions on the property. | Land | Improvement |
|---|---|---|---|---|
| 2025 | $720 | $21,560 | $5,110 | $16,450 |
| 2024 | $720 | $15,160 | $5,500 | $9,660 |
| 2023 | $581 | $15,160 | $5,500 | $9,660 |
| 2022 | $579 | $15,160 | $5,500 | $9,660 |
| 2021 | $481 | $11,660 | $4,240 | $7,420 |
| 2020 | $482 | $11,660 | $4,240 | $7,420 |
| 2019 | $484 | $11,660 | $4,240 | $7,420 |
| 2018 | $407 | $9,770 | $3,330 | $6,440 |
| 2017 | $414 | $9,770 | $3,330 | $6,440 |
| 2016 | $409 | $9,770 | $3,330 | $6,440 |
| 2015 | $377 | $9,390 | $3,190 | $6,200 |
| 2014 | $377 | $9,390 | $3,190 | $6,200 |
| 2013 | $364 | $9,390 | $3,190 | $6,200 |
Source: Public Records
Map
Nearby Homes
Your Personal Tour Guide
Ask me questions while you tour the home.