27 Norwich St Concord, NH 03301
South End NeighborhoodEstimated Value: $517,866 - $606,000
3
Beds
2
Baths
1,687
Sq Ft
$333/Sq Ft
Est. Value
About This Home
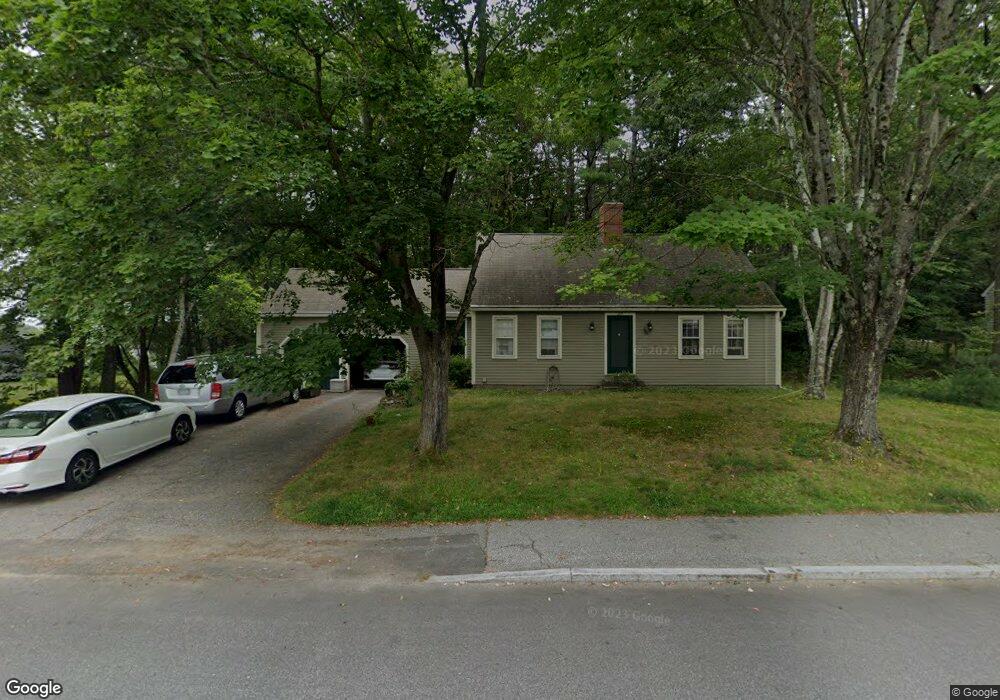
This home is located at 27 Norwich St, Concord, NH 03301 and is currently estimated at $561,717, approximately $332 per square foot. 27 Norwich St is a home located in Merrimack County with nearby schools including Abbot-Downing School, Rundlett Middle School, and Concord High School.
Ownership History
Date
Name
Owned For
Owner Type
Purchase Details
Closed on
Apr 20, 2005
Sold by
Fonda Christine E
Bought by
Cooper Elizabeth S
Current Estimated Value
Home Financials for this Owner
Home Financials are based on the most recent Mortgage that was taken out on this home.
Original Mortgage
$233,600
Outstanding Balance
$121,251
Interest Rate
5.87%
Mortgage Type
Purchase Money Mortgage
Estimated Equity
$440,466
Create a Home Valuation Report for This Property
The Home Valuation Report is an in-depth analysis detailing your home's value as well as a comparison with similar homes in the area
Home Values in the Area
Average Home Value in this Area
Purchase History
| Date | Buyer | Sale Price | Title Company |
|---|---|---|---|
| Cooper Elizabeth S | $292,000 | -- |
Source: Public Records
Mortgage History
| Date | Status | Borrower | Loan Amount |
|---|---|---|---|
| Open | Cooper Elizabeth S | $233,600 |
Source: Public Records
Tax History Compared to Growth
Tax History
| Year | Tax Paid | Tax Assessment Tax Assessment Total Assessment is a certain percentage of the fair market value that is determined by local assessors to be the total taxable value of land and additions on the property. | Land | Improvement |
|---|---|---|---|---|
| 2024 | $9,871 | $356,500 | $135,100 | $221,400 |
| 2023 | $9,576 | $356,500 | $135,100 | $221,400 |
| 2022 | $9,230 | $356,500 | $135,100 | $221,400 |
| 2021 | $8,850 | $352,300 | $135,200 | $217,100 |
| 2020 | $8,483 | $317,000 | $106,300 | $210,700 |
| 2019 | $8,031 | $289,100 | $110,300 | $178,800 |
| 2018 | $7,857 | $278,700 | $110,700 | $168,000 |
| 2017 | $7,698 | $272,600 | $110,700 | $161,900 |
| 2016 | $7,252 | $262,100 | $108,700 | $153,400 |
| 2015 | $6,983 | $257,500 | $118,100 | $139,400 |
| 2014 | $6,904 | $257,500 | $118,100 | $139,400 |
| 2013 | -- | $254,700 | $118,100 | $136,600 |
| 2012 | -- | $255,300 | $124,400 | $130,900 |
Source: Public Records
Map
Nearby Homes
- 22 Wilson Ave
- 15 Wilson Ave
- 0 South St Unit 4969509
- 122 South St
- 12 Avon St
- 105 S Main St
- 0 Spruce St Unit 88
- 33 Spruce St
- 24 Badger St
- 47 South St
- 289 South St
- 2 Kensington Rd
- 376 S Main St
- 1 Kensington Rd
- 14 Downing St
- 14-16 Perley St
- 10 Perley St
- 53 Heather Ln
- 87 S Main St Unit 2
- 54 Pleasant St Unit 8