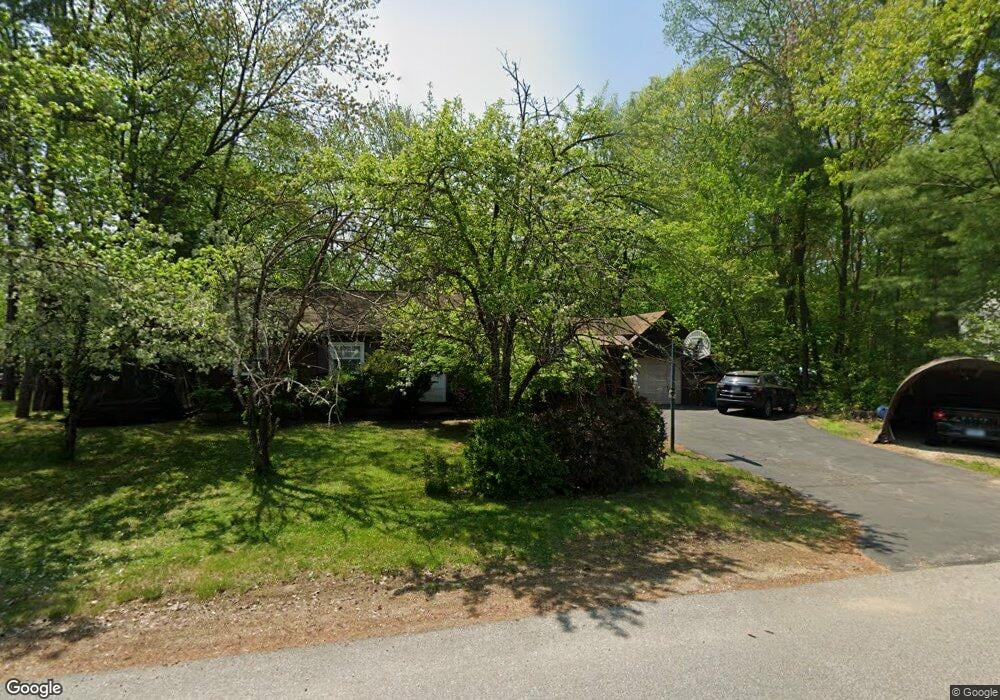
27 Nutter St Rochester, NH 03867
Estimated Value: $325,000 - $385,000
3
Beds
1
Bath
988
Sq Ft
$357/Sq Ft
Est. Value
About This Home
This home is located at 27 Nutter St, Rochester, NH 03867 and is currently estimated at $352,228, approximately $356 per square foot. 27 Nutter St is a home located in Strafford County with nearby schools including Chamberlain Street School, Rochester Middle School, and Spaulding High School.
Ownership History
Date
Name
Owned For
Owner Type
Purchase Details
Closed on
Jul 26, 2007
Sold by
Sandy Brook Corp
Bought by
Crocker Kenneth N and Crocker Sara W
Current Estimated Value
Home Financials for this Owner
Home Financials are based on the most recent Mortgage that was taken out on this home.
Original Mortgage
$288,000
Outstanding Balance
$178,368
Interest Rate
6.78%
Mortgage Type
Purchase Money Mortgage
Estimated Equity
$173,860
Purchase Details
Closed on
May 25, 1970
Bought by
Holland Jay and Holland Annette E
Create a Home Valuation Report for This Property
The Home Valuation Report is an in-depth analysis detailing your home's value as well as a comparison with similar homes in the area
Home Values in the Area
Average Home Value in this Area
Purchase History
| Date | Buyer | Sale Price | Title Company |
|---|---|---|---|
| Crocker Kenneth N | $320,000 | -- | |
| Holland Jay | -- | -- |
Source: Public Records
Mortgage History
| Date | Status | Borrower | Loan Amount |
|---|---|---|---|
| Open | Holland Jay | $288,000 |
Source: Public Records
Tax History
| Year | Tax Paid | Tax Assessment Tax Assessment Total Assessment is a certain percentage of the fair market value that is determined by local assessors to be the total taxable value of land and additions on the property. | Land | Improvement |
|---|---|---|---|---|
| 2025 | $3,912 | $255,700 | $82,500 | $173,200 |
| 2024 | $3,797 | $255,700 | $82,500 | $173,200 |
| 2023 | $3,686 | $143,200 | $53,900 | $89,300 |
| 2022 | $3,620 | $143,200 | $53,900 | $89,300 |
| 2021 | $3,530 | $143,200 | $53,900 | $89,300 |
| 2020 | $3,534 | $143,600 | $53,900 | $89,700 |
| 2019 | $3,576 | $143,600 | $53,900 | $89,700 |
| 2018 | $3,264 | $118,600 | $40,400 | $78,200 |
| 2017 | $3,123 | $118,600 | $40,400 | $78,200 |
| 2016 | $2,962 | $104,800 | $40,400 | $64,400 |
| 2015 | $2,950 | $104,800 | $40,400 | $64,400 |
| 2014 | $2,879 | $104,800 | $40,400 | $64,400 |
| 2013 | $3,045 | $115,500 | $53,900 | $61,600 |
| 2012 | $2,966 | $115,500 | $53,900 | $61,600 |
Source: Public Records
Map
Nearby Homes
- 0 Franklin St Unit 55 4959653
- 57 Franklin St
- 8 Adams Ave
- 20 Franklin Heights
- 66 Franklin Heights
- 10 Sarah Ct
- 33 Linden St
- 68 Moose Ln
- 45 Hanson St
- 15 Linden St
- 24 Jeremiah Ln
- 3 Dodge St
- 2 Barker Ct
- 18 Wakefield St
- 616 Portland St Unit 68
- 43 Fieldstone Ln
- 51 Richardson St
- 17-19 Upham St
- 2 Freedom Dr
- 3 Freedom Dr Unit 17
Your Personal Tour Guide
Ask me questions while you tour the home.