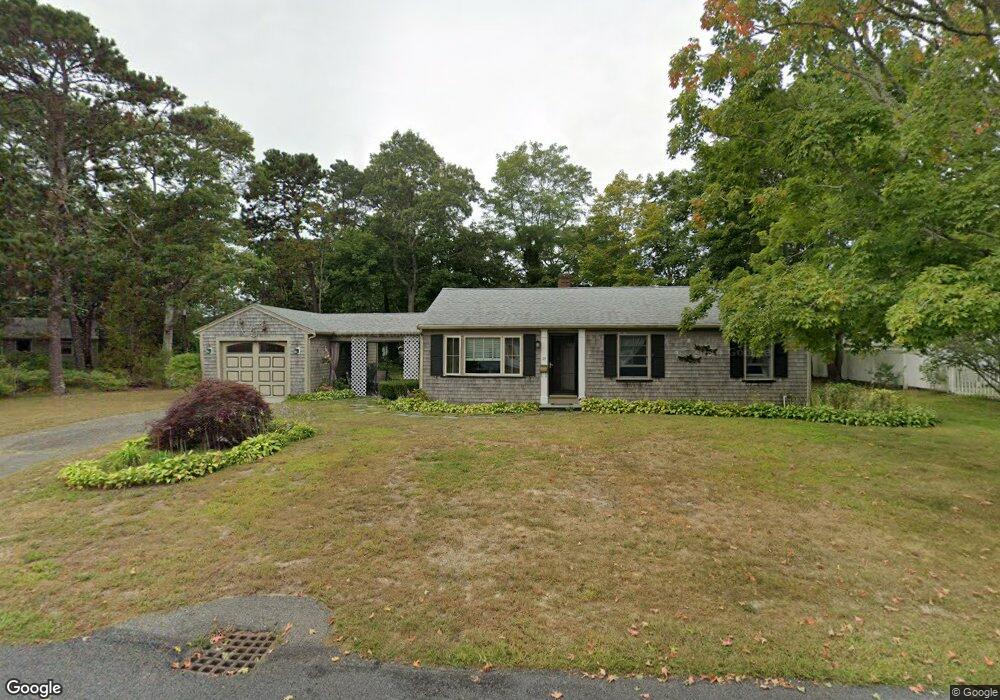
27 Oliver St South Yarmouth, MA 02664
Estimated Value: $513,000 - $539,000
3
Beds
1
Bath
960
Sq Ft
$546/Sq Ft
Est. Value
About This Home
This home is located at 27 Oliver St, South Yarmouth, MA 02664 and is currently estimated at $524,392, approximately $546 per square foot. 27 Oliver St is a home located in Barnstable County with nearby schools including Dennis-Yarmouth Regional High School and St. Pius X. School.
Ownership History
Date
Name
Owned For
Owner Type
Purchase Details
Closed on
Jan 5, 2023
Sold by
Andresen Flora
Bought by
Flora Andresen Ret
Current Estimated Value
Purchase Details
Closed on
Oct 31, 2022
Sold by
27 Oliver Street Rt
Bought by
Andresen Flora
Purchase Details
Closed on
May 19, 2016
Sold by
Horvath Bronco J and Andresen Flora
Bought by
27 Oliver Street Rt
Purchase Details
Closed on
Jun 13, 2014
Sold by
Horvath Bronco J
Bought by
Horvath Bronco J and Andresen Flora
Purchase Details
Closed on
May 25, 1973
Bought by
Horvath Bronco J and Andresen Flora
Create a Home Valuation Report for This Property
The Home Valuation Report is an in-depth analysis detailing your home's value as well as a comparison with similar homes in the area
Home Values in the Area
Average Home Value in this Area
Purchase History
| Date | Buyer | Sale Price | Title Company |
|---|---|---|---|
| Flora Andresen Ret | -- | None Available | |
| Andresen Flora | -- | None Available | |
| 27 Oliver Street Rt | -- | -- | |
| Horvath Bronco J | -- | -- | |
| Horvath Bronco J | -- | -- |
Source: Public Records
Tax History Compared to Growth
Tax History
| Year | Tax Paid | Tax Assessment Tax Assessment Total Assessment is a certain percentage of the fair market value that is determined by local assessors to be the total taxable value of land and additions on the property. | Land | Improvement |
|---|---|---|---|---|
| 2025 | $3,173 | $448,200 | $179,600 | $268,600 |
| 2024 | $3,066 | $415,500 | $151,900 | $263,600 |
| 2023 | $2,961 | $365,100 | $131,500 | $233,600 |
| 2022 | $2,795 | $304,500 | $119,500 | $185,000 |
| 2021 | $2,635 | $275,600 | $119,500 | $156,100 |
| 2020 | $2,583 | $258,300 | $119,500 | $138,800 |
| 2019 | $2,398 | $237,400 | $119,500 | $117,900 |
| 2018 | $2,261 | $219,700 | $101,800 | $117,900 |
| 2017 | $2,157 | $215,300 | $97,400 | $117,900 |
| 2016 | $2,060 | $206,400 | $88,500 | $117,900 |
| 2015 | $1,878 | $187,100 | $88,500 | $98,600 |
Source: Public Records
Map
Nearby Homes