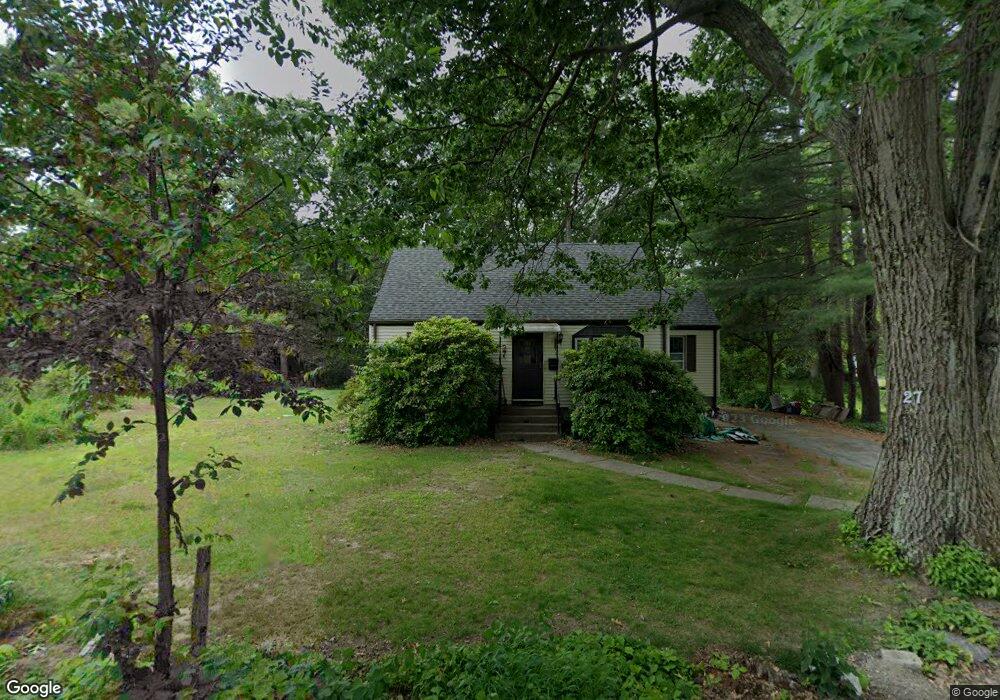
27 Outlook Dr Worcester, MA 01602
Webster Square NeighborhoodEstimated Value: $371,000 - $463,000
3
Beds
1
Bath
1,263
Sq Ft
$325/Sq Ft
Est. Value
About This Home
This home is located at 27 Outlook Dr, Worcester, MA 01602 and is currently estimated at $410,033, approximately $324 per square foot. 27 Outlook Dr is a home located in Worcester County with nearby schools including Tatnuck Magnet School, Chandler Magnet, and Jacob Hiatt Magnet School.
Ownership History
Date
Name
Owned For
Owner Type
Purchase Details
Closed on
Jul 14, 2023
Sold by
Lloyd Charles S
Bought by
Murphy-Lloyd Ronna J
Current Estimated Value
Purchase Details
Closed on
Jul 2, 1993
Sold by
Robinson James and Robinson Lois
Bought by
Murphy Ronna J and Lloyd Charles
Home Financials for this Owner
Home Financials are based on the most recent Mortgage that was taken out on this home.
Original Mortgage
$102,250
Interest Rate
7.46%
Mortgage Type
Purchase Money Mortgage
Create a Home Valuation Report for This Property
The Home Valuation Report is an in-depth analysis detailing your home's value as well as a comparison with similar homes in the area
Home Values in the Area
Average Home Value in this Area
Purchase History
| Date | Buyer | Sale Price | Title Company |
|---|---|---|---|
| Murphy-Lloyd Ronna J | -- | None Available | |
| Murphy Ronna J | $106,000 | -- |
Source: Public Records
Mortgage History
| Date | Status | Borrower | Loan Amount |
|---|---|---|---|
| Previous Owner | Murphy Ronna J | $102,250 |
Source: Public Records
Tax History
| Year | Tax Paid | Tax Assessment Tax Assessment Total Assessment is a certain percentage of the fair market value that is determined by local assessors to be the total taxable value of land and additions on the property. | Land | Improvement |
|---|---|---|---|---|
| 2025 | $4,396 | $333,300 | $98,500 | $234,800 |
| 2024 | $4,300 | $312,700 | $98,500 | $214,200 |
| 2023 | $4,206 | $293,300 | $85,700 | $207,600 |
| 2022 | $3,860 | $253,800 | $68,600 | $185,200 |
| 2021 | $3,624 | $222,600 | $54,900 | $167,700 |
| 2020 | $3,516 | $206,800 | $54,500 | $152,300 |
| 2019 | $3,314 | $184,100 | $47,600 | $136,500 |
| 2018 | $3,319 | $175,500 | $47,600 | $127,900 |
| 2017 | $3,167 | $164,800 | $47,600 | $117,200 |
| 2016 | $3,118 | $151,300 | $34,000 | $117,300 |
| 2015 | $3,037 | $151,300 | $34,000 | $117,300 |
| 2014 | $2,956 | $151,300 | $34,000 | $117,300 |
Source: Public Records
Map
Nearby Homes
- 22 Outlook Dr
- 5 Swan Ave
- 415 Mill St
- 6 Ludington Rd
- 34 Scandinavia Ave
- 57 1st St
- 34 Rosslare Dr Unit 108
- 32 Zenith Dr
- 47R Yarnie Unit 3A
- 47R Yarnie Unit 1B
- 47R Yarnie Unit 2B
- 47R Yarnie Unit 4B
- 47R Yarnie Unit 8B
- 47R Yarnie Unit 5A
- 47R Yarnie Unit 6B
- 47R Yarnie Unit 4A
- 47R Yarnie Unit 1A
- 47R Yarnie Unit 9
- 47R Yarnie Unit 8A
- 47R Yarnie Unit 6A
Your Personal Tour Guide
Ask me questions while you tour the home.