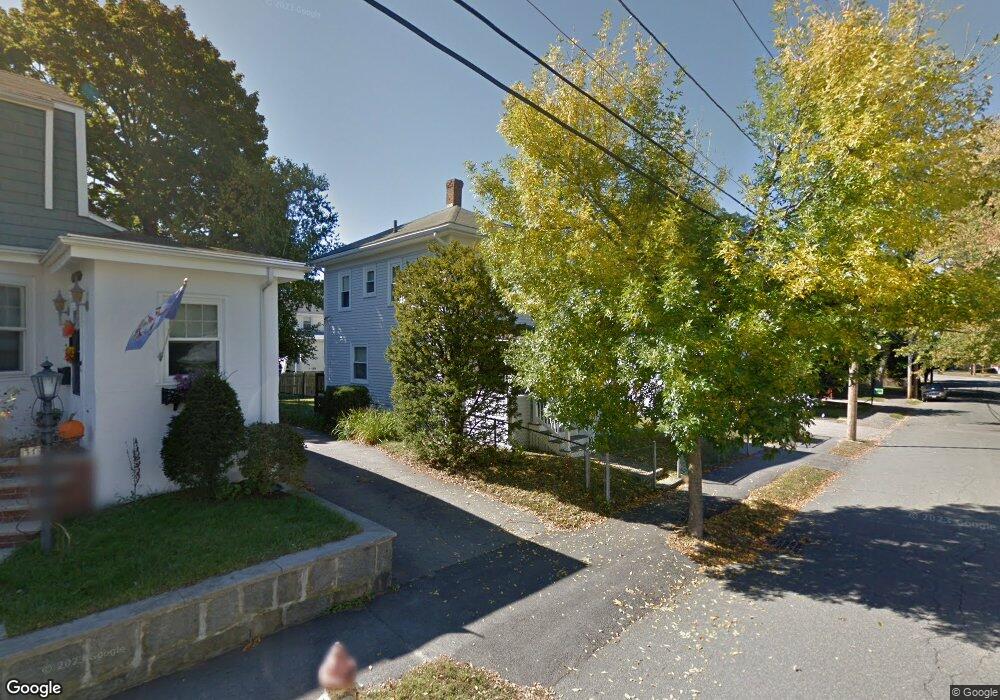
27 Pelican Rd Quincy, MA 02169
Adams Shore NeighborhoodEstimated Value: $759,000 - $818,000
2
Beds
1
Bath
1,800
Sq Ft
$436/Sq Ft
Est. Value
About This Home
This home is located at 27 Pelican Rd, Quincy, MA 02169 and is currently estimated at $785,573, approximately $436 per square foot. 27 Pelican Rd is a home located in Norfolk County with nearby schools including Merrymount Elementary School, Broad Meadows Middle School, and Quincy High School.
Ownership History
Date
Name
Owned For
Owner Type
Purchase Details
Closed on
Feb 20, 2015
Sold by
Evelyn A Snowling Ft
Bought by
Grazioso John M and Grazioso Samantha J
Current Estimated Value
Home Financials for this Owner
Home Financials are based on the most recent Mortgage that was taken out on this home.
Original Mortgage
$228,000
Outstanding Balance
$173,991
Interest Rate
3.74%
Mortgage Type
New Conventional
Estimated Equity
$611,582
Purchase Details
Closed on
May 22, 2012
Sold by
Snowling Evelyn A
Bought by
Evelyn A Snowling Ft
Create a Home Valuation Report for This Property
The Home Valuation Report is an in-depth analysis detailing your home's value as well as a comparison with similar homes in the area
Home Values in the Area
Average Home Value in this Area
Purchase History
| Date | Buyer | Sale Price | Title Company |
|---|---|---|---|
| Grazioso John M | $285,000 | -- | |
| Evelyn A Snowling Ft | -- | -- |
Source: Public Records
Mortgage History
| Date | Status | Borrower | Loan Amount |
|---|---|---|---|
| Open | Grazioso John M | $228,000 |
Source: Public Records
Tax History Compared to Growth
Tax History
| Year | Tax Paid | Tax Assessment Tax Assessment Total Assessment is a certain percentage of the fair market value that is determined by local assessors to be the total taxable value of land and additions on the property. | Land | Improvement |
|---|---|---|---|---|
| 2025 | $8,778 | $761,300 | $285,200 | $476,100 |
| 2024 | $8,380 | $743,600 | $276,900 | $466,700 |
| 2023 | $7,539 | $677,400 | $240,800 | $436,600 |
| 2022 | $7,588 | $633,400 | $218,900 | $414,500 |
| 2021 | $7,051 | $580,800 | $218,900 | $361,900 |
| 2020 | $4,328 | $348,200 | $210,500 | $137,700 |
| 2019 | $4,118 | $328,100 | $196,700 | $131,400 |
| 2018 | $3,902 | $292,500 | $171,000 | $121,500 |
| 2017 | $3,986 | $281,300 | $171,000 | $110,300 |
| 2016 | $4,060 | $282,700 | $171,000 | $111,700 |
| 2015 | $3,854 | $264,000 | $161,400 | $102,600 |
| 2014 | $3,685 | $248,000 | $153,700 | $94,300 |
Source: Public Records
Map
Nearby Homes
- 503 Sea St
- 73 Albatross Rd
- 599 Sea St
- 599 Sea St Unit 1
- 37 Hobomack Rd
- 12 Quentin St
- 10 Forbush Ave
- 188 Samoset Ave
- 105 Sea St Unit 301
- 105 Sea St Unit 203
- 105 Sea St Unit 105
- 200 Cove Way Unit 614
- 1421 Quincy Shore Dr
- 1427 Quincy Shore Dr
- 7 Manet Ave
- 18 Allerton St
- 16 Perley Place
- 161 Sumner St Unit 2
- 161 Sumner St Unit 4
- 313 Washington St