Estimated Value: $238,469 - $300,000
2
Beds
2
Baths
1,700
Sq Ft
$158/Sq Ft
Est. Value
About This Home
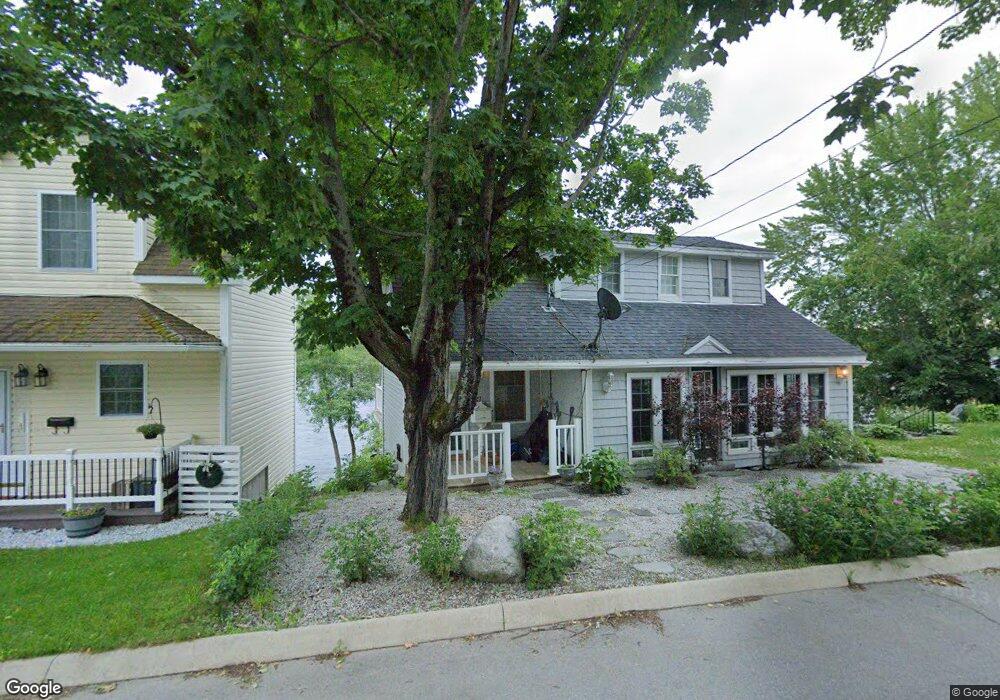
This home is located at 27 Penobscot St, Orono, ME 04473 and is currently estimated at $268,617, approximately $158 per square foot. 27 Penobscot St is a home located in Penobscot County with nearby schools including Orono Middle School and Orono High School.
Ownership History
Date
Name
Owned For
Owner Type
Purchase Details
Closed on
Aug 23, 2021
Sold by
Snively Scott A
Bought by
Snively Scott A and Snively Glenna
Current Estimated Value
Purchase Details
Closed on
Jun 7, 2016
Sold by
Argent Lori Ann E
Bought by
Gavett 2Nd Peter
Home Financials for this Owner
Home Financials are based on the most recent Mortgage that was taken out on this home.
Original Mortgage
$178,212
Interest Rate
3.99%
Mortgage Type
FHA
Purchase Details
Closed on
Feb 21, 2012
Sold by
Oconnor Maurice P and Oconnor Coral Jeanne
Bought by
Argent Lori Ann E
Home Financials for this Owner
Home Financials are based on the most recent Mortgage that was taken out on this home.
Original Mortgage
$280,000
Interest Rate
3.93%
Mortgage Type
Purchase Money Mortgage
Purchase Details
Closed on
Aug 4, 2006
Sold by
Ppl Maine Llc
Bought by
Brayson Robert L
Create a Home Valuation Report for This Property
The Home Valuation Report is an in-depth analysis detailing your home's value as well as a comparison with similar homes in the area
Home Values in the Area
Average Home Value in this Area
Purchase History
| Date | Buyer | Sale Price | Title Company |
|---|---|---|---|
| Snively Scott A | -- | None Available | |
| Gavett 2Nd Peter | -- | -- | |
| Argent Lori Ann E | -- | -- | |
| Brayson Robert L | $33,000 | -- |
Source: Public Records
Mortgage History
| Date | Status | Borrower | Loan Amount |
|---|---|---|---|
| Previous Owner | Gavett 2Nd Peter | $178,212 | |
| Previous Owner | Argent Lori Ann E | $280,000 |
Source: Public Records
Tax History Compared to Growth
Tax History
| Year | Tax Paid | Tax Assessment Tax Assessment Total Assessment is a certain percentage of the fair market value that is determined by local assessors to be the total taxable value of land and additions on the property. | Land | Improvement |
|---|---|---|---|---|
| 2024 | $3,683 | $172,500 | $41,600 | $130,900 |
| 2023 | $3,669 | $156,800 | $37,800 | $119,000 |
| 2022 | $3,732 | $156,800 | $37,800 | $119,000 |
| 2021 | $3,724 | $156,800 | $37,800 | $119,000 |
| 2020 | $4,744 | $168,900 | $47,400 | $121,500 |
| 2019 | $4,467 | $168,900 | $47,400 | $121,500 |
| 2018 | $4,560 | $168,900 | $47,400 | $121,500 |
| 2017 | $4,391 | $168,900 | $47,400 | $121,500 |
| 2016 | $4,197 | $168,900 | $47,400 | $121,500 |
| 2015 | $4,121 | $168,900 | $47,400 | $121,500 |
| 2014 | $4,152 | $174,100 | $52,600 | $121,500 |
| 2013 | $4,039 | $174,100 | $52,600 | $121,500 |
Source: Public Records
Map
Nearby Homes
- 31 Penobscot St
- 23 Penobscot St
- 34 Penobscot St
- 38 Penobscot St
- 24 Penobscot St
- 37 Penobscot St
- 22 Penobscot St
- 15 Penobscot St
- 18 Penobscot St
- 20 Penobscot St
- 57 Hillside Rd
- 59 Hillside Rd
- 53 Hillside Rd
- 61 Hillside Rd
- 00 Penobscot St
- 16 Penobscot St Unit 2
- 14 Penobscot St
- 37 Hillside Rd
- 6 Shore Dr Unit 3
- 63 Hillside Rd