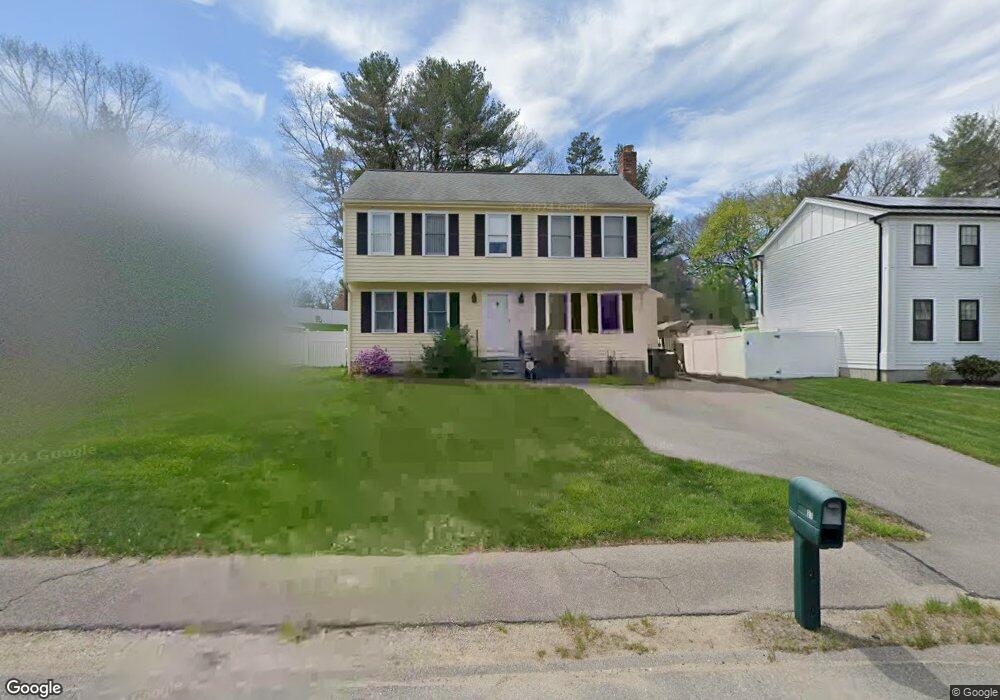
27 Perry Henderson Dr Framingham, MA 01701
Nobscot NeighborhoodEstimated Value: $742,949 - $807,000
3
Beds
3
Baths
2,166
Sq Ft
$357/Sq Ft
Est. Value
About This Home
This home is located at 27 Perry Henderson Dr, Framingham, MA 01701 and is currently estimated at $772,987, approximately $356 per square foot. 27 Perry Henderson Dr is a home located in Middlesex County with nearby schools including Framingham High School, MetroWest Jewish Day School, and Summit Montessori School.
Ownership History
Date
Name
Owned For
Owner Type
Purchase Details
Closed on
Aug 1, 2025
Sold by
Cronson Howard R and Cronson Alison L
Bought by
Eaton Lauren
Current Estimated Value
Home Financials for this Owner
Home Financials are based on the most recent Mortgage that was taken out on this home.
Original Mortgage
$618,400
Outstanding Balance
$615,198
Interest Rate
6.81%
Mortgage Type
New Conventional
Estimated Equity
$157,789
Purchase Details
Closed on
Jul 28, 1994
Sold by
Johnson Albert E and Johnson Judith H
Bought by
Cronson Howard R and Cronson Alison L
Purchase Details
Closed on
Jun 12, 1987
Sold by
Aseltine Richard G
Bought by
Johnson Albert E
Create a Home Valuation Report for This Property
The Home Valuation Report is an in-depth analysis detailing your home's value as well as a comparison with similar homes in the area
Home Values in the Area
Average Home Value in this Area
Purchase History
| Date | Buyer | Sale Price | Title Company |
|---|---|---|---|
| Eaton Lauren | $773,000 | -- | |
| Eaton Lauren | $773,000 | -- | |
| Cronson Howard R | $195,000 | -- | |
| Cronson Howard R | $195,000 | -- | |
| Johnson Albert E | $223,500 | -- |
Source: Public Records
Mortgage History
| Date | Status | Borrower | Loan Amount |
|---|---|---|---|
| Open | Eaton Lauren | $618,400 | |
| Closed | Eaton Lauren | $618,400 | |
| Previous Owner | Johnson Albert E | $25,000 | |
| Previous Owner | Johnson Albert E | $168,000 |
Source: Public Records
Tax History
| Year | Tax Paid | Tax Assessment Tax Assessment Total Assessment is a certain percentage of the fair market value that is determined by local assessors to be the total taxable value of land and additions on the property. | Land | Improvement |
|---|---|---|---|---|
| 2025 | $8,192 | $686,100 | $262,500 | $423,600 |
| 2024 | $8,286 | $665,000 | $234,400 | $430,600 |
| 2023 | $7,870 | $601,200 | $209,200 | $392,000 |
| 2022 | $7,476 | $544,100 | $189,900 | $354,200 |
| 2021 | $7,309 | $520,200 | $182,500 | $337,700 |
| 2020 | $7,406 | $494,400 | $165,800 | $328,600 |
| 2019 | $7,405 | $481,500 | $165,800 | $315,700 |
| 2018 | $6,815 | $417,600 | $159,600 | $258,000 |
| 2017 | $6,592 | $394,500 | $155,000 | $239,500 |
| 2016 | $6,490 | $373,400 | $155,000 | $218,400 |
| 2015 | $6,374 | $357,700 | $154,900 | $202,800 |
Source: Public Records
Map
Nearby Homes
- 25 Perry Henderson Dr
- 29 Perry Henderson Dr
- 23 Perry Henderson Dr
- 31 Perry Henderson Dr
- 69 Leigh St
- 32 Perry Henderson Dr
- 30 Perry Henderson Dr
- 71 Leigh St
- 21 Perry Henderson Dr
- 33 Perry Henderson Dr
- 67 Leigh St
- 28 Perry Henderson Dr
- 73 Leigh St
- 65 Leigh St
- 26 Perry Henderson Dr
- 19 Perry Henderson Dr
- 35 Perry Henderson Dr
- 24 Perry Henderson Dr
- 75 Leigh St
- 63 Leigh St
Your Personal Tour Guide
Ask me questions while you tour the home.