Estimated Value: $296,000 - $441,000
3
Beds
3
Baths
2,208
Sq Ft
$157/Sq Ft
Est. Value
About This Home
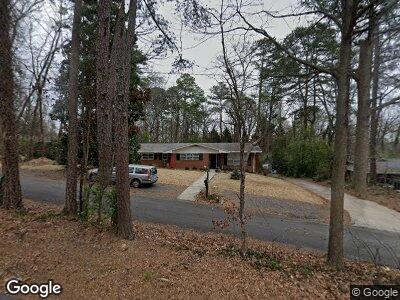
This home is located at 27 Pine Valley Rd SW, Rome, GA 30165 and is currently estimated at $347,598, approximately $157 per square foot. 27 Pine Valley Rd SW is a home located in Floyd County with nearby schools including Rome High School.
Ownership History
Date
Name
Owned For
Owner Type
Purchase Details
Closed on
Sep 25, 2020
Sold by
Ruston Blanche E
Bought by
Hobgood James H and Hobgood Lou Ella
Current Estimated Value
Home Financials for this Owner
Home Financials are based on the most recent Mortgage that was taken out on this home.
Original Mortgage
$120,000
Outstanding Balance
$107,933
Interest Rate
2.9%
Mortgage Type
New Conventional
Estimated Equity
$239,665
Purchase Details
Closed on
Nov 8, 2012
Sold by
Wilkins Sondra Ruston
Bought by
Ruston Blanche Eble
Purchase Details
Closed on
Jun 21, 1983
Sold by
O'Dell Margaret R
Bought by
Ruston George M and Ruston Blanche E
Purchase Details
Closed on
Jun 11, 1978
Sold by
Ward Marjorie Wright
Bought by
O'Dell Margaret R
Purchase Details
Closed on
Feb 27, 1975
Sold by
Ward Carlos M
Bought by
Ward Marjorie Wright
Purchase Details
Closed on
Aug 2, 1965
Sold by
Swords Robert J
Bought by
Ward Carlos M
Purchase Details
Closed on
Aug 29, 1963
Sold by
Cooper W
Bought by
Swords Robert J
Purchase Details
Closed on
Jan 1, 1901
Bought by
Cooper W
Create a Home Valuation Report for This Property
The Home Valuation Report is an in-depth analysis detailing your home's value as well as a comparison with similar homes in the area
Home Values in the Area
Average Home Value in this Area
Purchase History
| Date | Buyer | Sale Price | Title Company |
|---|---|---|---|
| Hobgood James H | $185,000 | -- | |
| Ruston Blanche Eble | -- | -- | |
| Ruston George M | $67,000 | -- | |
| O'Dell Margaret R | -- | -- | |
| Ward Marjorie Wright | $48,000 | -- | |
| Ward Carlos M | $28,600 | -- | |
| Swords Robert J | $25,500 | -- | |
| Cooper W | -- | -- |
Source: Public Records
Mortgage History
| Date | Status | Borrower | Loan Amount |
|---|---|---|---|
| Open | Hobgood James H | $120,000 |
Source: Public Records
Tax History Compared to Growth
Tax History
| Year | Tax Paid | Tax Assessment Tax Assessment Total Assessment is a certain percentage of the fair market value that is determined by local assessors to be the total taxable value of land and additions on the property. | Land | Improvement |
|---|---|---|---|---|
| 2024 | $2,528 | $101,118 | $19,280 | $81,838 |
| 2023 | $2,528 | $97,748 | $17,527 | $80,221 |
| 2022 | $2,294 | $83,069 | $14,606 | $68,463 |
| 2021 | $2,837 | $76,455 | $13,438 | $63,017 |
| 2020 | $1,595 | $70,954 | $10,224 | $60,730 |
| 2019 | $1,533 | $68,569 | $10,224 | $58,345 |
| 2018 | $1,488 | $66,025 | $10,224 | $55,801 |
| 2017 | $1,452 | $63,946 | $10,224 | $53,722 |
| 2016 | $1,448 | $63,360 | $10,200 | $53,160 |
| 2015 | -- | $62,306 | $10,200 | $52,106 |
| 2014 | -- | $62,306 | $10,200 | $52,106 |
Source: Public Records
Map
Nearby Homes
- 0 Featherston Rd SW Unit 10512723
- 0 Featherston Rd SW Unit 13890394
- 338 Mount Alto Rd SW
- 39 Dogwood Dr SW
- 45 Mountain Crest Dr SW
- 27 Bluff Mountain Dr SW
- 0 Bluff Mountain Rd Unit 7405844
- 0 Bluff Mountain Rd Unit 10320975
- 11 Brow Rd SW
- 0 Hidden Ridge Dr Unit 10343706
- 0 Hidden Ridge Dr Unit 10343701
- 0 Hidden Ridge Dr Unit 10343700
- 0 Hidden Ridge Dr Unit 10343696
- 0 Hidden Ridge Dr Unit 10343694
- 0 Hidden Ridge Dr Unit 10343693
- 0 Hidden Ridge Dr Unit 10343689
- 0 Hidden Ridge Dr Unit 10343688
- 0 Hidden Ridge Dr Unit 10343685
- 0 Hidden Ridge Dr Unit 10343680
- 0 Hidden Ridge Dr Unit 10343676
- 27 Pine Valley Rd SW
- 29 Pine Valley Rd SW
- 25 Pine Valley Rd SW Unit 42
- 25 Pine Valley Rd SW
- 28 Pine Valley Rd SW
- 30 Pine Valley Rd SW
- 31 Pine Valley Rd SW
- 18 Crestwood Dr SW
- 20 Crestwood Dr SW
- 23 Pine Valley Rd SW
- 26 Pine Valley Rd SW
- 201 Woodglen Rd SW
- 16 Crestwood Dr SW
- 33 Pine Valley Rd SW
- 1 Hilldale Ln SW
- 22 Crestwood Dr SW
- 21 Pine Valley Rd SW
- 4 Hilldale Ln SW
- 11 Crestwood Dr SW
- 203 Woodglen Rd SW