Estimated Value: $455,000 - $557,000
3
Beds
2
Baths
1,654
Sq Ft
$311/Sq Ft
Est. Value
About This Home
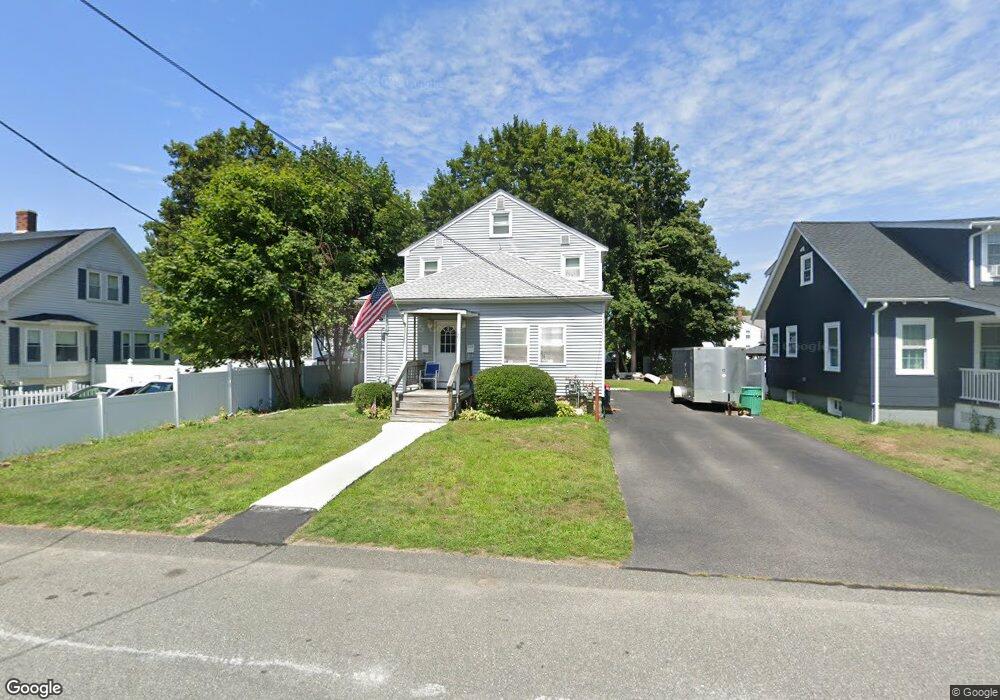
This home is located at 27 Pratt St, Avon, MA 02322 and is currently estimated at $514,286, approximately $310 per square foot. 27 Pratt St is a home located in Norfolk County with nearby schools including Ralph D. Butler Elementary School and Avon Middle/High School.
Ownership History
Date
Name
Owned For
Owner Type
Purchase Details
Closed on
Sep 1, 1994
Sold by
Tullis Tr Robert D
Bought by
Hansen John E
Current Estimated Value
Home Financials for this Owner
Home Financials are based on the most recent Mortgage that was taken out on this home.
Original Mortgage
$81,950
Interest Rate
8.44%
Mortgage Type
Purchase Money Mortgage
Purchase Details
Closed on
Aug 16, 1994
Sold by
Burton Ray M and Cirsair Rt
Bought by
Tullis Tr Robert D
Home Financials for this Owner
Home Financials are based on the most recent Mortgage that was taken out on this home.
Original Mortgage
$81,950
Interest Rate
8.44%
Mortgage Type
Purchase Money Mortgage
Create a Home Valuation Report for This Property
The Home Valuation Report is an in-depth analysis detailing your home's value as well as a comparison with similar homes in the area
Home Values in the Area
Average Home Value in this Area
Purchase History
| Date | Buyer | Sale Price | Title Company |
|---|---|---|---|
| Hansen John E | $85,000 | -- | |
| Tullis Tr Robert D | $51,000 | -- |
Source: Public Records
Mortgage History
| Date | Status | Borrower | Loan Amount |
|---|---|---|---|
| Open | Tullis Tr Robert D | $80,000 | |
| Closed | Tullis Tr Robert D | $120,500 | |
| Closed | Hansen John E | $81,950 | |
| Previous Owner | Tullis Tr Robert D | $90,000 |
Source: Public Records
Tax History
| Year | Tax Paid | Tax Assessment Tax Assessment Total Assessment is a certain percentage of the fair market value that is determined by local assessors to be the total taxable value of land and additions on the property. | Land | Improvement |
|---|---|---|---|---|
| 2025 | $50 | $374,400 | $173,500 | $200,900 |
| 2024 | $5,127 | $365,400 | $164,500 | $200,900 |
| 2023 | $4,977 | $365,400 | $164,500 | $200,900 |
| 2022 | $4,525 | $286,200 | $137,100 | $149,100 |
| 2021 | $4,185 | $249,400 | $124,300 | $125,100 |
| 2020 | $4,354 | $246,000 | $121,900 | $124,100 |
| 2019 | $4,476 | $248,800 | $121,900 | $126,900 |
| 2018 | $4,615 | $248,800 | $121,900 | $126,900 |
| 2017 | $4,310 | $249,400 | $121,900 | $127,500 |
| 2016 | $4,021 | $235,000 | $121,900 | $113,100 |
| 2015 | $3,665 | $223,900 | $110,800 | $113,100 |
Source: Public Records
Map
Nearby Homes
Your Personal Tour Guide
Ask me questions while you tour the home.