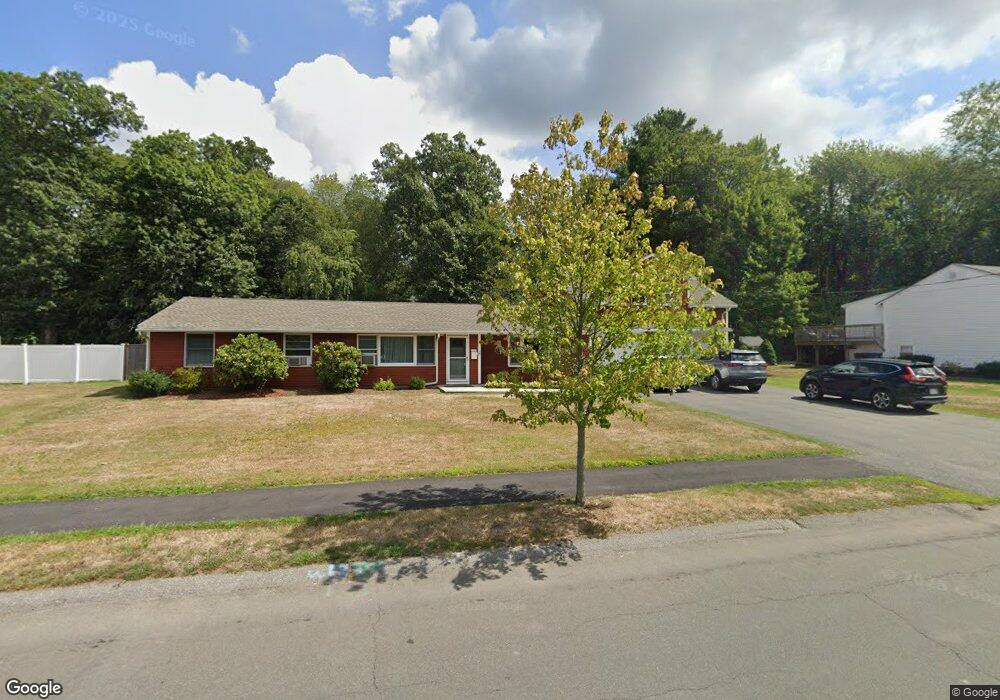
27 Princeton St Danvers, MA 01923
Estimated Value: $666,000 - $748,000
3
Beds
3
Baths
1,562
Sq Ft
$455/Sq Ft
Est. Value
About This Home
This home is located at 27 Princeton St, Danvers, MA 01923 and is currently estimated at $710,450, approximately $454 per square foot. 27 Princeton St is a home located in Essex County with nearby schools including Danvers High School, St. Mary of the Annunciation School, and St. John's Prep.
Ownership History
Date
Name
Owned For
Owner Type
Purchase Details
Closed on
Dec 22, 2017
Sold by
Fellows Constructions
Bought by
Rmj Development Llc
Current Estimated Value
Purchase Details
Closed on
Nov 14, 1995
Sold by
Thurston Kevin and Thurston Sharon L
Bought by
Taylor Mark and Taylor Linda A
Purchase Details
Closed on
Jun 30, 1988
Sold by
Finn George
Bought by
Thurston Kevin
Create a Home Valuation Report for This Property
The Home Valuation Report is an in-depth analysis detailing your home's value as well as a comparison with similar homes in the area
Home Values in the Area
Average Home Value in this Area
Purchase History
| Date | Buyer | Sale Price | Title Company |
|---|---|---|---|
| Rmj Development Llc | $270,000 | -- | |
| Rmj Development Llc | $270,000 | -- | |
| Taylor Mark | $156,000 | -- | |
| Thurston Kevin | $153,000 | -- |
Source: Public Records
Mortgage History
| Date | Status | Borrower | Loan Amount |
|---|---|---|---|
| Previous Owner | Thurston Kevin | $160,000 | |
| Previous Owner | Thurston Kevin | $25,000 |
Source: Public Records
Tax History
| Year | Tax Paid | Tax Assessment Tax Assessment Total Assessment is a certain percentage of the fair market value that is determined by local assessors to be the total taxable value of land and additions on the property. | Land | Improvement |
|---|---|---|---|---|
| 2025 | $7,182 | $653,500 | $379,400 | $274,100 |
| 2024 | $7,062 | $635,600 | $379,400 | $256,200 |
| 2023 | $6,796 | $578,400 | $344,800 | $233,600 |
| 2022 | $6,679 | $527,600 | $312,800 | $214,800 |
| 2021 | $6,429 | $481,600 | $296,300 | $185,300 |
| 2020 | $6,023 | $461,200 | $292,900 | $168,300 |
| 2019 | $5,771 | $434,600 | $266,300 | $168,300 |
| 2018 | $5,625 | $415,400 | $263,600 | $151,800 |
| 2017 | $5,395 | $380,200 | $230,300 | $149,900 |
| 2016 | $5,163 | $363,600 | $219,700 | $143,900 |
| 2015 | $5,029 | $337,300 | $199,700 | $137,600 |
Source: Public Records
Map
Nearby Homes
- 9 Maple St
- 4 Enon Rd
- 17 Amherst St
- 52 Coolidge Rd
- 207 Topsfield Rd
- 12 Chestnut St
- 180 Conant Conant St
- 155 Maple St Unit 1
- 120 Conant St
- 29 Elliott St
- 4 Alden St Unit 3
- 19 Bridle Spur Ln
- 71 Conant St Unit 3
- 29 Conant St
- 466 Newbury St Unit 20
- 10 Oxbow Rd
- 200 North St
- 200 North St Unit 23-B
- 320 Newbury St Unit 704
- 17 Princeton Ave
- 29 Princeton St
- 25 Princeton St
- 34 Princeton St
- 32 Princeton St
- 32 Princeton St
- 8 Burnham Ln
- 36 Princeton St
- 31 Princeton St
- 30 Princeton St
- 7 Burnham Ln
- 3 Woodland Rd
- 23 Princeton St
- 38 Princeton St
- 6 Burnham Ln
- 13 Dartmouth St
- 33 Princeton St
- 15 Dartmouth St
- 5 Burnham Ln
- 17 Dartmouth St
- 4 Perkins Rd
Your Personal Tour Guide
Ask me questions while you tour the home.