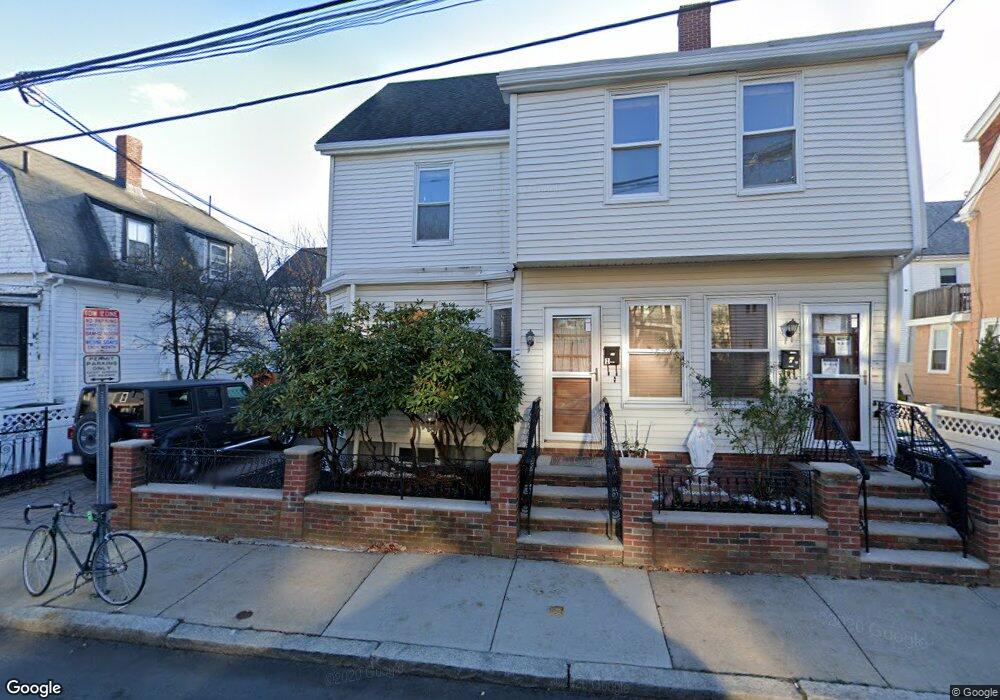
27 Princeton St Somerville, MA 02144
Magoun Square NeighborhoodEstimated Value: $993,000 - $1,190,013
4
Beds
2
Baths
1,500
Sq Ft
$722/Sq Ft
Est. Value
About This Home
This property is situated in an unbeatable location in Medford just minutes to Tufts University! Near parks, shopping, outdoor recreation, dining, nightlife, bars, and more! Convenient short trip to Red Line at Davis station as well as many major MBTA bus routes! Close to Davis Square, Teele Square, Powder House Square, Porter Square, as well as a quick T ride to Cambridge’s Harvard, Central, and Kendall Squares, Downtown Boston, Mass General Hospital, South Station commuter trains, and all that the Boston area has to offer! Easy commute to schools including Harvard University, Lesley University, and MIT! A truly wonderful location!
Ownership History
Date
Name
Owned For
Owner Type
Purchase Details
Closed on
Apr 18, 2006
Sold by
Moura Silvino C
Bought by
Oliver Nelly and Moura Silvino C
Current Estimated Value
Purchase Details
Closed on
Jan 9, 1989
Sold by
Hepburn Bradley J S
Bought by
Moura Silvino C
Home Financials for this Owner
Home Financials are based on the most recent Mortgage that was taken out on this home.
Original Mortgage
$195,000
Interest Rate
10.32%
Mortgage Type
Purchase Money Mortgage
Create a Home Valuation Report for This Property
The Home Valuation Report is an in-depth analysis detailing your home's value as well as a comparison with similar homes in the area
Home Values in the Area
Average Home Value in this Area
Purchase History
| Date | Buyer | Sale Price | Title Company |
|---|---|---|---|
| Oliver Nelly | -- | -- | |
| Moura Silvino C | $220,000 | -- |
Source: Public Records
Mortgage History
| Date | Status | Borrower | Loan Amount |
|---|---|---|---|
| Open | Moura Silvino C | $100,000 | |
| Previous Owner | Moura Silvino C | $195,000 |
Source: Public Records
Property History
| Date | Event | Price | List to Sale | Price per Sq Ft |
|---|---|---|---|---|
| 06/01/2025 06/01/25 | For Rent | $4,100 | 0.0% | -- |
| 10/08/2024 10/08/24 | Off Market | $4,100 | -- | -- |
Tax History Compared to Growth
Tax History
| Year | Tax Paid | Tax Assessment Tax Assessment Total Assessment is a certain percentage of the fair market value that is determined by local assessors to be the total taxable value of land and additions on the property. | Land | Improvement |
|---|---|---|---|---|
| 2025 | $10,670 | $978,000 | $544,700 | $433,300 |
| 2024 | $10,041 | $954,500 | $544,700 | $409,800 |
| 2023 | $9,795 | $947,300 | $544,700 | $402,600 |
| 2022 | $9,221 | $905,800 | $518,800 | $387,000 |
| 2021 | $8,523 | $836,400 | $494,100 | $342,300 |
| 2020 | $8,046 | $797,400 | $475,100 | $322,300 |
| 2019 | $7,422 | $689,800 | $413,100 | $276,700 |
| 2018 | $7,011 | $619,900 | $375,500 | $244,400 |
| 2017 | $6,692 | $573,400 | $354,300 | $219,100 |
| 2016 | $6,551 | $522,800 | $324,000 | $198,800 |
Source: Public Records
Map
Nearby Homes
- 8 Albion Terrace
- 156 Albion St Unit B
- 303 Lowell St Unit 1
- 80 Hudson St
- 13 Warwick St
- 7 Woodbine St
- 10 Roberts St Unit 14
- 32 Richardson St
- 35 Richardson St Unit 2
- 35 Richardson St Unit 4
- 35 Richardson St Unit Cottage
- 27 Boston Ave
- 3 Vinal St
- 15 Spring Hill Terrace
- 15 Albion St
- 34 Fiske Ave Unit C
- 496 Medford St
- 125 Lowell St Unit 4C
- 125 Lowell St Unit 203
- 125 Lowell St Unit 5A
- 27 Princeton St
- 27 Princeton St Unit 1
- 82 Alpine St
- 23 Princeton St Unit 2
- 23 Princeton St
- 23 Princeton St Unit 1
- 23 Princeton St Unit 3
- 31 Princeton St
- 74 Alpine St
- 76 Alpine St
- 74 Alpine St Unit 74
- 86 Alpine St
- 24 Princeton St
- 24 Princeton St Unit 1
- 17 Princeton St
- 17 Princeton St Unit 3
- 17 Princeton St
- 17 Princeton St Unit 3T
- 17 Princeton St Unit 2
- 17 Princeton St Unit 1