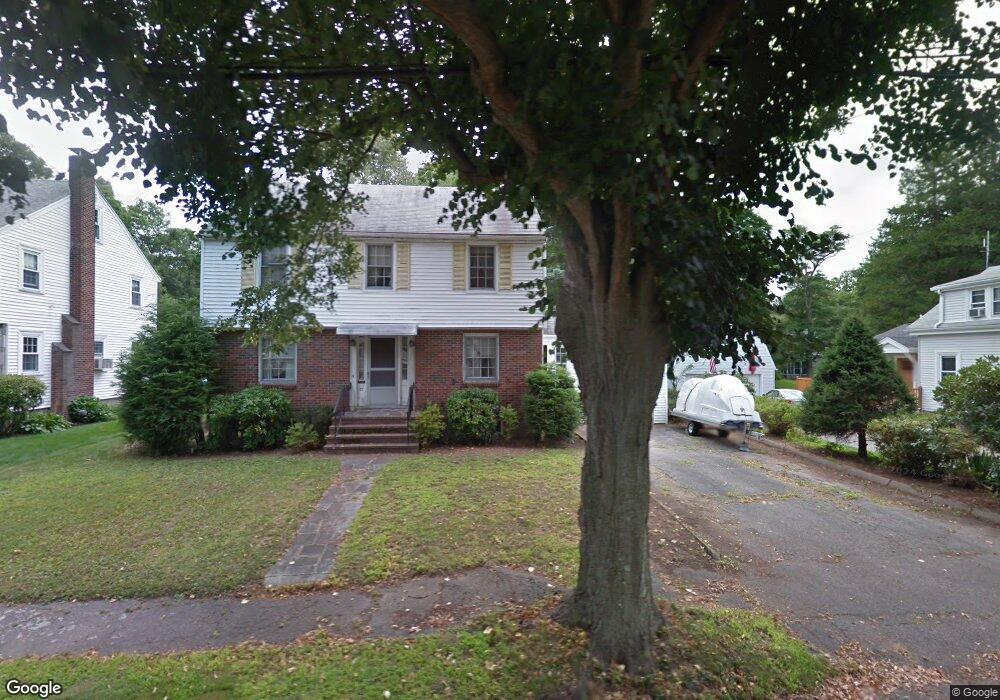
27 Quarry Ln Milton, MA 02186
Estimated Value: $897,000 - $944,242
3
Beds
2
Baths
1,568
Sq Ft
$591/Sq Ft
Est. Value
About This Home
This home is located at 27 Quarry Ln, Milton, MA 02186 and is currently estimated at $926,561, approximately $590 per square foot. 27 Quarry Ln is a home located in Norfolk County with nearby schools including Milton High School, Milton Academy, and Fontbonne Academy.
Ownership History
Date
Name
Owned For
Owner Type
Purchase Details
Closed on
Aug 29, 2018
Sold by
Pardy Thomas A Est
Bought by
Orourke Sean P
Current Estimated Value
Home Financials for this Owner
Home Financials are based on the most recent Mortgage that was taken out on this home.
Original Mortgage
$508,250
Outstanding Balance
$442,311
Interest Rate
4.5%
Mortgage Type
New Conventional
Estimated Equity
$484,250
Purchase Details
Closed on
Jul 3, 1985
Bought by
Pardy Thomas A
Create a Home Valuation Report for This Property
The Home Valuation Report is an in-depth analysis detailing your home's value as well as a comparison with similar homes in the area
Purchase History
| Date | Buyer | Sale Price | Title Company |
|---|---|---|---|
| Orourke Sean P | $535,000 | -- | |
| Pardy Thomas A | $58,500 | -- |
Source: Public Records
Mortgage History
| Date | Status | Borrower | Loan Amount |
|---|---|---|---|
| Open | Orourke Sean P | $508,250 |
Source: Public Records
Tax History
| Year | Tax Paid | Tax Assessment Tax Assessment Total Assessment is a certain percentage of the fair market value that is determined by local assessors to be the total taxable value of land and additions on the property. | Land | Improvement |
|---|---|---|---|---|
| 2025 | $9,658 | $870,900 | $485,300 | $385,600 |
| 2024 | $9,376 | $858,600 | $462,200 | $396,400 |
| 2023 | $9,134 | $801,200 | $440,500 | $360,700 |
| 2022 | $8,991 | $721,000 | $440,500 | $280,500 |
| 2021 | $8,767 | $667,700 | $400,500 | $267,200 |
| 2020 | $8,195 | $624,600 | $383,800 | $240,800 |
| 2019 | $7,992 | $606,400 | $372,600 | $233,800 |
| 2018 | $8,077 | $584,900 | $355,200 | $229,700 |
| 2017 | $7,561 | $557,600 | $338,300 | $219,300 |
| 2016 | $7,029 | $520,700 | $306,100 | $214,600 |
| 2015 | $6,857 | $491,900 | $281,900 | $210,000 |
Source: Public Records
Map
Nearby Homes
- 97 Pleasant St
- 403405 Reedsdale Rd
- 111-113 Pleasant St
- 207 Pleasant St
- 40 Dean Rd
- 341 Highland St
- 88 Patricia Dr
- 6 Brewster Rd
- 46 Century Ln
- 260 Canton Ave
- 484 Brook Rd
- 424 Brook Rd
- 161 Sassamon Ave
- 17 Quisset Brook Rd
- 1185 Brook Rd
- 4 Farmer Rd
- 46 Audubon Rd
- 397 Adams St
- 7 Preacher Rd
- 400 Adams St Unit A
Your Personal Tour Guide
Ask me questions while you tour the home.