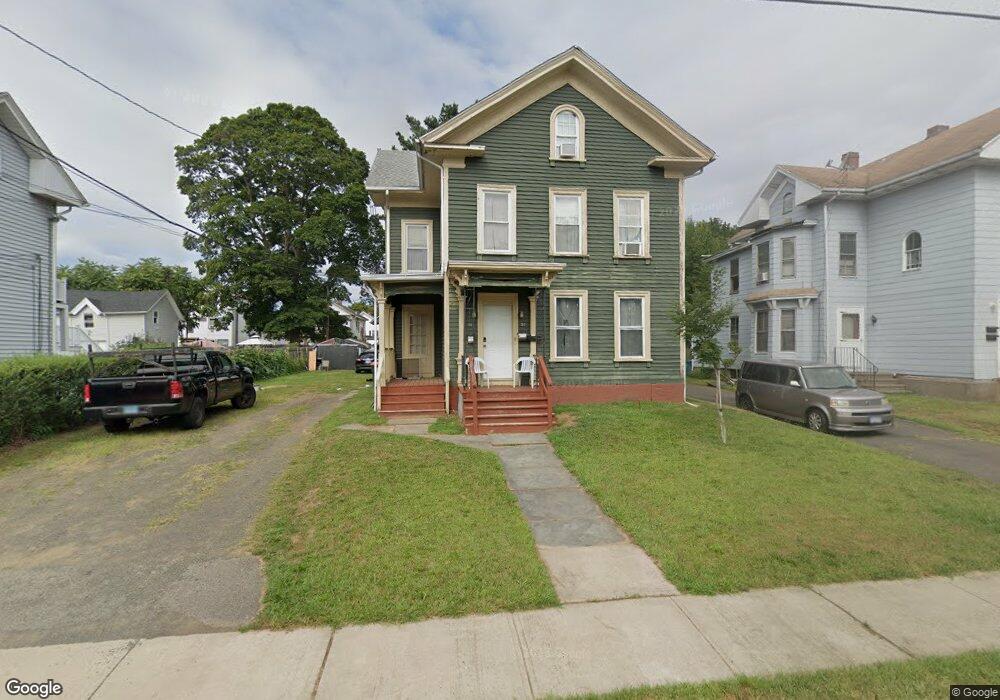
27 Queen St Meriden, CT 06451
Estimated Value: $272,612 - $356,000
5
Beds
2
Baths
2,396
Sq Ft
$129/Sq Ft
Est. Value
About This Home
This home is located at 27 Queen St, Meriden, CT 06451 and is currently estimated at $309,153, approximately $129 per square foot. 27 Queen St is a home located in New Haven County with nearby schools including Casimir Pulaski School, Lincoln Middle School, and Orville H. Platt High School.
Ownership History
Date
Name
Owned For
Owner Type
Purchase Details
Closed on
Jul 13, 2007
Sold by
Cox Tina M
Bought by
Dejesus Edwin
Current Estimated Value
Home Financials for this Owner
Home Financials are based on the most recent Mortgage that was taken out on this home.
Original Mortgage
$145,403
Outstanding Balance
$90,360
Interest Rate
6.48%
Estimated Equity
$218,793
Purchase Details
Closed on
Oct 1, 2001
Sold by
Seitlinger David J and Seitlinger Carol D
Bought by
Cox Tina M
Home Financials for this Owner
Home Financials are based on the most recent Mortgage that was taken out on this home.
Original Mortgage
$85,400
Interest Rate
6.91%
Purchase Details
Closed on
May 29, 1987
Sold by
Duval Robert E
Bought by
Seitlinger David J
Create a Home Valuation Report for This Property
The Home Valuation Report is an in-depth analysis detailing your home's value as well as a comparison with similar homes in the area
Home Values in the Area
Average Home Value in this Area
Purchase History
| Date | Buyer | Sale Price | Title Company |
|---|---|---|---|
| Dejesus Edwin | $149,900 | -- | |
| Cox Tina M | $89,900 | -- | |
| Seitlinger David J | $118,000 | -- |
Source: Public Records
Mortgage History
| Date | Status | Borrower | Loan Amount |
|---|---|---|---|
| Open | Seitlinger David J | $145,403 | |
| Previous Owner | Seitlinger David J | $109,000 | |
| Previous Owner | Seitlinger David J | $85,400 | |
| Previous Owner | Seitlinger David J | $32,320 |
Source: Public Records
Tax History
| Year | Tax Paid | Tax Assessment Tax Assessment Total Assessment is a certain percentage of the fair market value that is determined by local assessors to be the total taxable value of land and additions on the property. | Land | Improvement |
|---|---|---|---|---|
| 2025 | $4,607 | $121,520 | $28,910 | $92,610 |
| 2024 | $4,680 | $121,520 | $28,910 | $92,610 |
| 2023 | $4,810 | $129,570 | $28,910 | $100,660 |
| 2022 | $4,538 | $129,570 | $28,910 | $100,660 |
| 2021 | $3,617 | $83,090 | $21,910 | $61,180 |
| 2020 | $3,607 | $83,090 | $21,910 | $61,180 |
| 2019 | $3,576 | $83,090 | $21,910 | $61,180 |
| 2018 | $3,590 | $83,090 | $21,910 | $61,180 |
| 2017 | $3,495 | $83,090 | $21,910 | $61,180 |
| 2016 | $4,177 | $107,730 | $37,800 | $69,930 |
| 2015 | $4,177 | $107,730 | $37,800 | $69,930 |
| 2014 | $4,075 | $107,730 | $37,800 | $69,930 |
Source: Public Records
Map
Nearby Homes
Your Personal Tour Guide
Ask me questions while you tour the home.